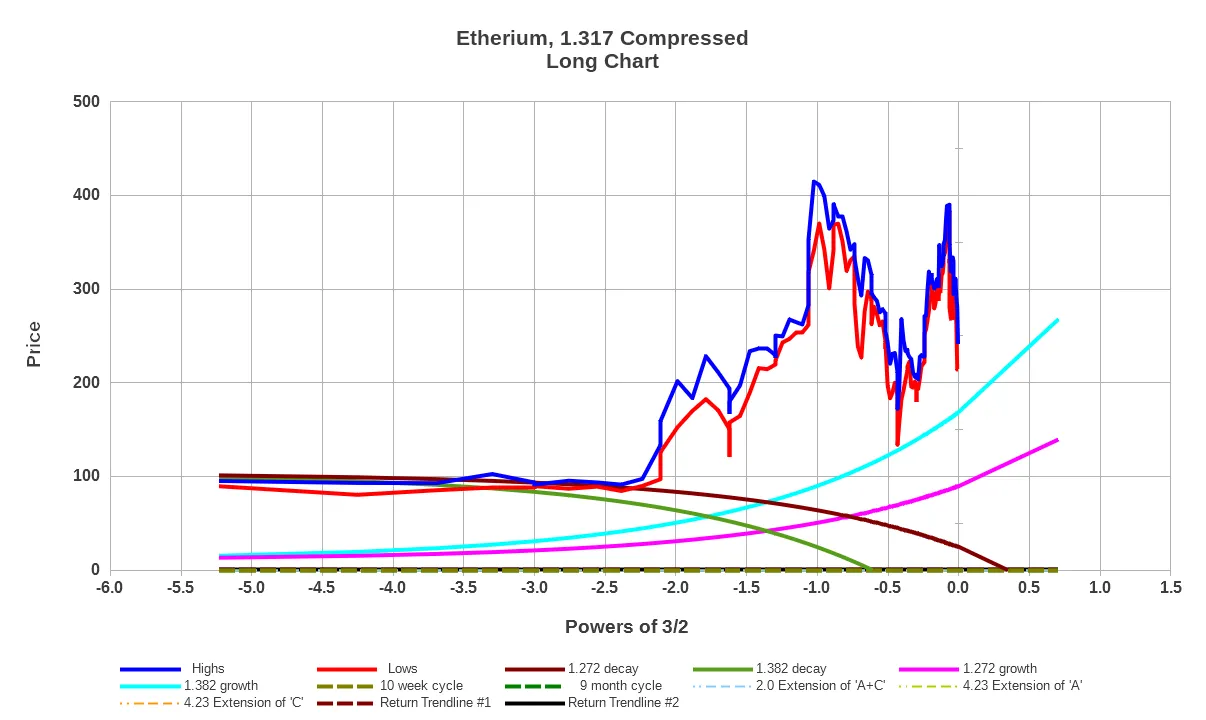
This is an unconventional chart, showing daily highs in dark blue and daily lows in dark red. The scale along the bottom is calendar days converted to a Logarithmic scale and the top in June crested at the Mathematically significant -1.0 marker.
As of 11:45 P.M. Central Time, the volume related to the current drop is underwhelming, so if more downside is imminent, watch for this mathematically derived light blue line to stop it.