Of course we're all waiting to see what Bitcoin is going to do, and I always look back to the past for inspiration or clues on what might happen. Having been in the space for several years I feel having a historic perspective is essential to understanding the cryptocurrency markets. I always look back at the big 2013/2014 bubble, when I first entered crypto.

COMPARING THE BUBBLES
One thing I've been doing for close to a year now is trying to overlay the 2013/2014 bubble onto the current Bitcoin price rise/bubble to see if I can find comparisons. Despite being a huge believer in the technology, I've suffered through the Great Depression once and I know it's sting. And contrary to many newer investors who only entered the space last year: I know it's real. Most people sadly underestimate the possibility of a repeat-scenario and only take it with a grain of salt.For the better part of last year it was hard finding comparisons of the bubbles, as the run-up seemed to have no end in sight and without a peak it's hard to compare. It wasn't until we finally peaked in December and a more serious downturn started, that we are able to really compare the two bubbles and peaks in the somewhat correct size ratio's.
I would like to present to you two Bitcoin charts: One is from 2013-2014 and the other is the current chart from 2017-2018. To make this into a little game, I have removed all indicators of dates and prices. Try to guess which of these charts is the current one, and which is the one from 4 years ago!
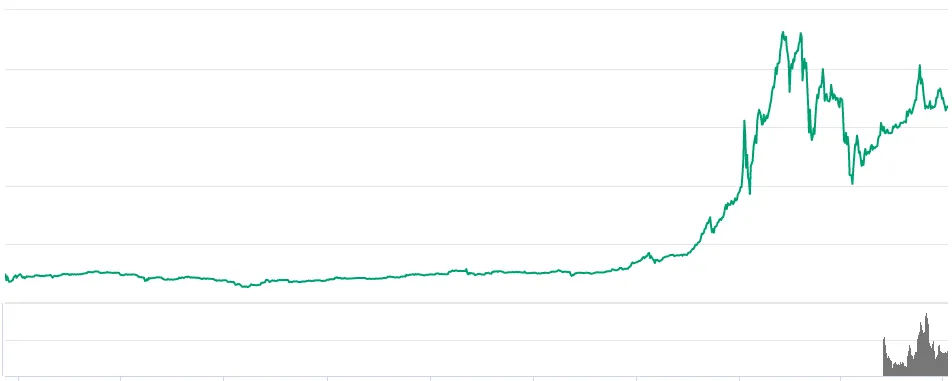
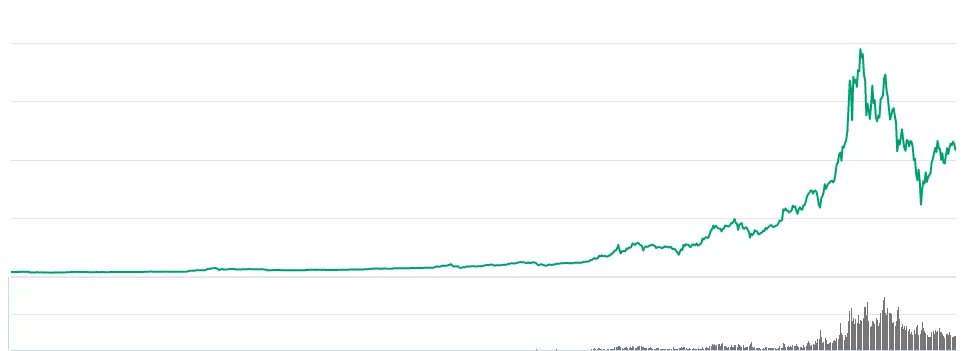
I didn't match them up precisely and they are still off, with one extending slightly farther to the right than the other. In any case, the resemblance should be clear. For clarity's sake: the first picture is from 2013-2014 and the second picture is the current Bitcoin chart.
As you can see there is a lot of things that match up between these bubbles. Both had a big peak, then some lower highs and finally a low before another bull attempt.
Personally, both love and loathe seeing these similarities. I like it because I feel I can perhaps look at what happened next in 2013-2014 to see if I can apply that to the present. But I also loathe it, because I know fully well what happened, and this question is more about the details rather than the big picture.
SO, WHAT HAPPENED?
You probably know the story, but let's start off with the Bitcoin chart, this time taken about a year after when the 2014 bubble popped: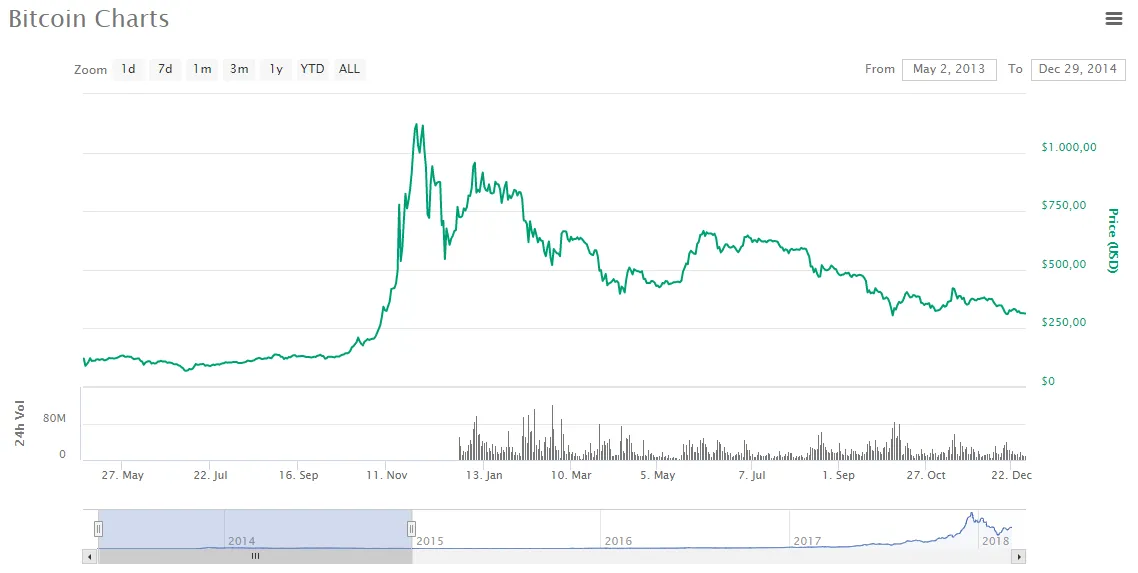
As you can see, the right-most high on the 2014 chart (first one in this post) has now turned into a definitive lower high, and we did not manage to break through to reach previous heights again. I remember in this period that there was much disbelief about a bear market, and people were adamant that the bulls would return any moment. This kept the price relatively raised, and slowly dwindling down without crashing too hard. At the beginning of 2015 the price of Bitcoin had slowly gone from about $1200 to about $260.
When we look at yet another chart a year later, at the beginning of 2016, we get this picture:
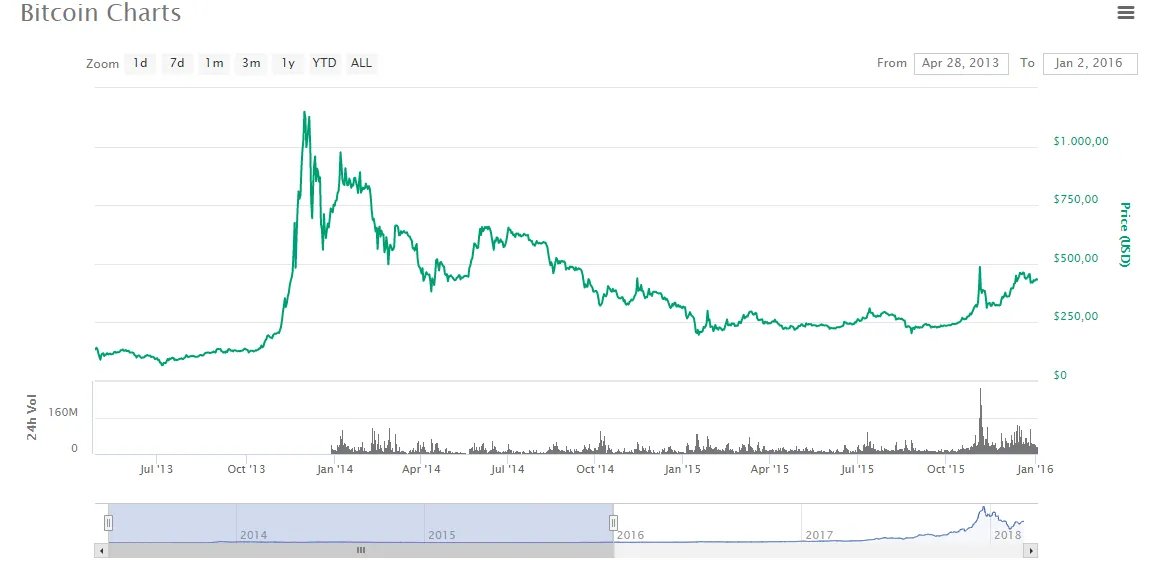
And looking at this, it turned out the low point of $260 was the actual bottom of the chart from then on. Of course, we know the story of how it turned out after that, and the continued bull market that ensued between 2016 and 2018, bringing us to where we currently are.
The point of this excercise, and what I am trying to make, is that we should take in consideration that a repeat of this scenario might very well ensue with Bitcoin. It has happened before, and before, and before. Many times.
The lesson I take from this all is that I am very concious of the fact that in the past, every time we have gone through a bubble we have not pushed through to new heights very shortly after at all. In fact, if I look at the current Bitcoin chart and assume the 2013-2014 scenario is to repeat, what we should see in the charts next is Bitcoin going bullish for a little while longer until it peaks at around $13.5-15K after which it will dwindle back down as the Bitcoin believers struggle to hold the line and stop the slow decline.
If the same ratio's are to be applied as last time, roughly guesstimating, that would mean a slow and agonizing decline towards the point where it is about 2x the price of what it was before it went parabolic. In 2013 it went from $125 to $1200 to eventually drop to a bottom of about $250.
It is hard guessing what the chart will look like a year from now, to really determine before which point the parabolic rise officially set in, but considering our first low was $6K and in the past the first low ($600) was not the lowest low ($210), then based on these numbers it would seem fair to assume that we could in fact see a lowest Bitcoin price of $2K before we actually bottom out. Personally I have been concious of the very real possibility that we may visit $4K at some point if things go sour.
A HAPPY NOTE
This all being said, I have to admit I am a natural skeptic and somewhat of a doomsday thinker when it comes to these things. I've been warning about the possibility of the bubble popping and making references to the 2013-2014 similarities since this past summer, and so far I've been wrong again and again. There's a very real possibility that this time things are different: because they are different in many ways. Much bigger. Then again, if we take fundamentals and psychology out and merely look at the graphs, the similarities are at the very least worthy of your considerations. It is my experience that these markets rarely follow rationality, and in fact tend to repeat itself in cycles and phases much to everyone's dismay.The good news is that even after a potential downturn, the future looks very bright indeed. For if a repeat of 2013-2014 is possible, then after finally bottoming out it means a repeat of 2017-2018 is very possible too! This would bring us on track to a Bitcoin worth more than $100K each. It also means that if you buy at the potential upcoming bottom, you could be rich if it all plays out like this.
But don't take any of my words as advice! Far from it! I merely aspire to make you think. My actual advice is to ignore all of this in your decisionmaking. If you try to play this game, and predict the future, eventually you will get shaken out by market manipulators. It is impossible to guess the bottom in advance, and with Lightning Network around the corner, Bitcoin fees dropping significantly and media coverage at an all time high, things could also finally be different this time. Perhaps a critical mass has been breached and there's no stopping now? If you sell, and this is the case, you will be out of the race and can perhaps never get back in for the same price.
My advice is the same as always: Don't worry about it. Just HODL and wait it out. Bitcoin was always a long-term play, and you should not be selling for the next 4 years anyway.
Personally, I'm happy either way. If the chart does a repeat of 2013-2014, I'm so going to buy a whole Bitcoin for $2K when I can. If it doesn't, then it means that Bitcoin will have gone up and I'm fine with that as well. I'm not selling my BTC in either case: I'm not selling for less than $1 million per Bitcoin. Otherwise, I HODL.
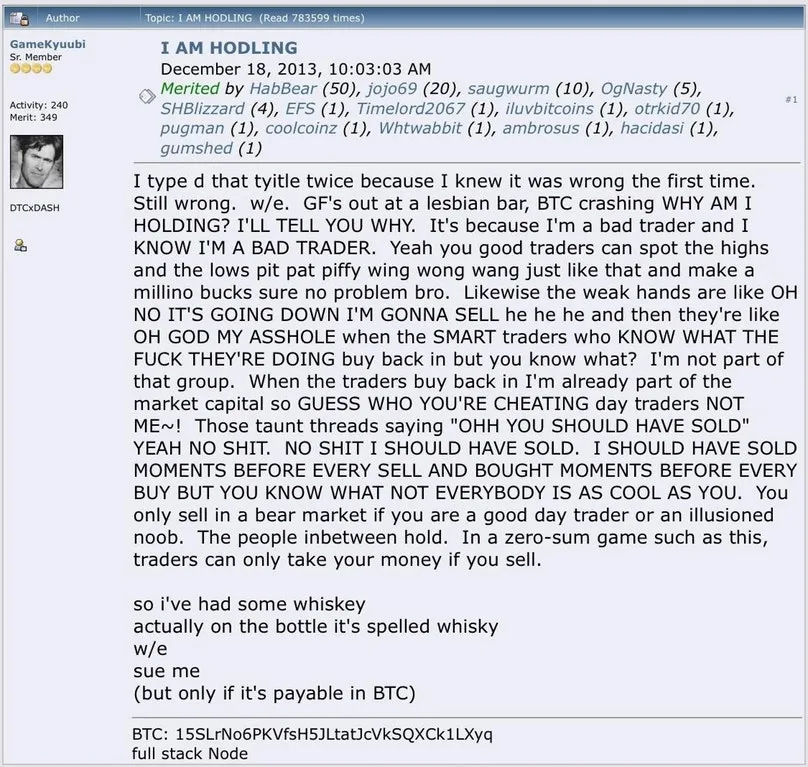
If you need a reminder on why you HODL, it's good to look back at the humble origins of the misspelling. This poor chap, who posted the message below on BitcoinTalk and thus invented the term HODL, may have been drunk, but he had the right idea and his reasoning wasn't too bad.