I'm highly excited about the Bitcoin price drop and I'm ready to buy. These are the price levels at which I am looking to buy Bitcoin (BTC) at in the dark times ahead.

Bearish so that we can be Bullish
I've been waiting long for Bitcoin to drop below $6000 and had almost given up on it happening even though all my TA indicated that it should happen. According to my theory, and that of many others, the drop we are currently experiencing is a painful but necessary move in order for the Bitcoin price chart to turn bullish again. When they say 'Buy the Dip', it's this dip they are talking about. When they say 'HODL' it's this dip through which we HODL, lest we get shaken out of the market. Once we have gone full maximum bearish with the price, all the way until there are no more bears left, only then will it be time to be bullish again. History repeats itself once more with Bitcoin. All of this has happened before and all of this will happen again - I am convinced. For me the coming months are my accummulation period. Make no mistake - this is going to last for months.
So now that we've finally breached the critical $6000 level and gone all the way below $5000 it is finally time for me to determine at which points I will be buying Bitcoin and I decided to share them with you. Of course, none of this should be taken as financial advice and please make up your own mind. I am merely letting you know what I am doing, so that you can reflect on it and make your own decision.
Below you can see my chart from tradingview where I have illustrated several levels at which I will be buying.
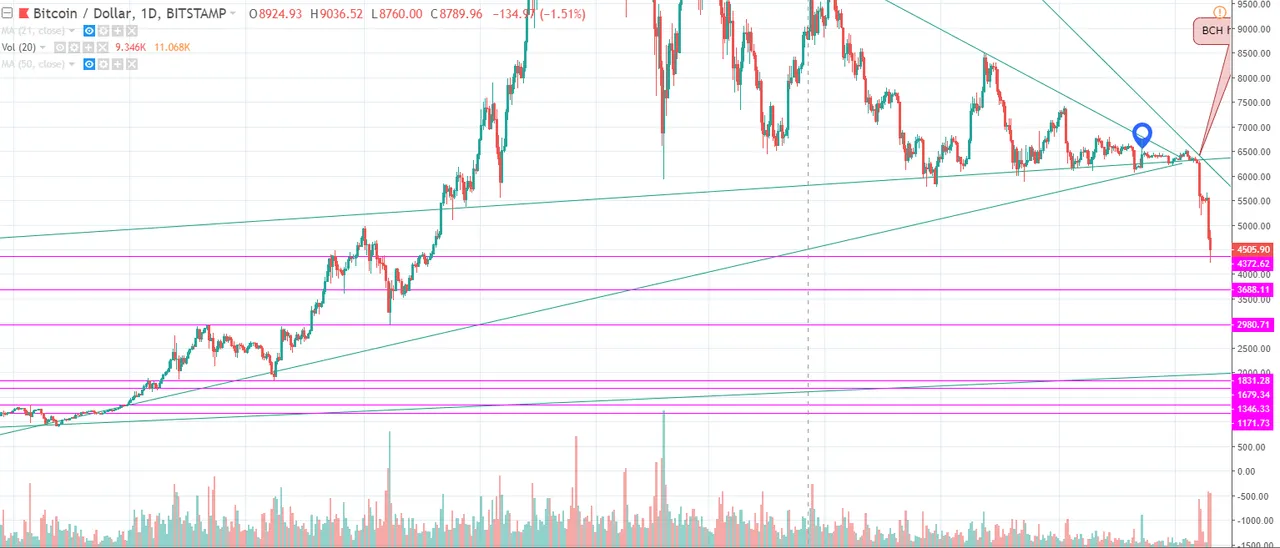
As you can see I have drawn horizontal pink lines at approximately:
- $4300
- $3700
- $3000
- $1850
- $1650
- $1350
- $1200
These are the levels at which I can identify significant support levels. I have drawn them approximately, so there are probably some optimizations to be made in order to get lower buy-in prices, but it's easy to miss a buy opportunity if you try to time it 100% and quite frankly I was too lazy to make it exact on the chart. There's no way to determine how far we will go, so I have created lines all the way down to $1200 which is about the lowest I can imagine it going (because it is the peak ATH of the bubble from 2013). I will be buying at each of these levels all the way down.
How low can we go
The way I see it is that this bubble is no different from the bubble from 2013/2014. As such I consider the previous bubble to be a great indicator and guideline on how to deal with the current bubble burst.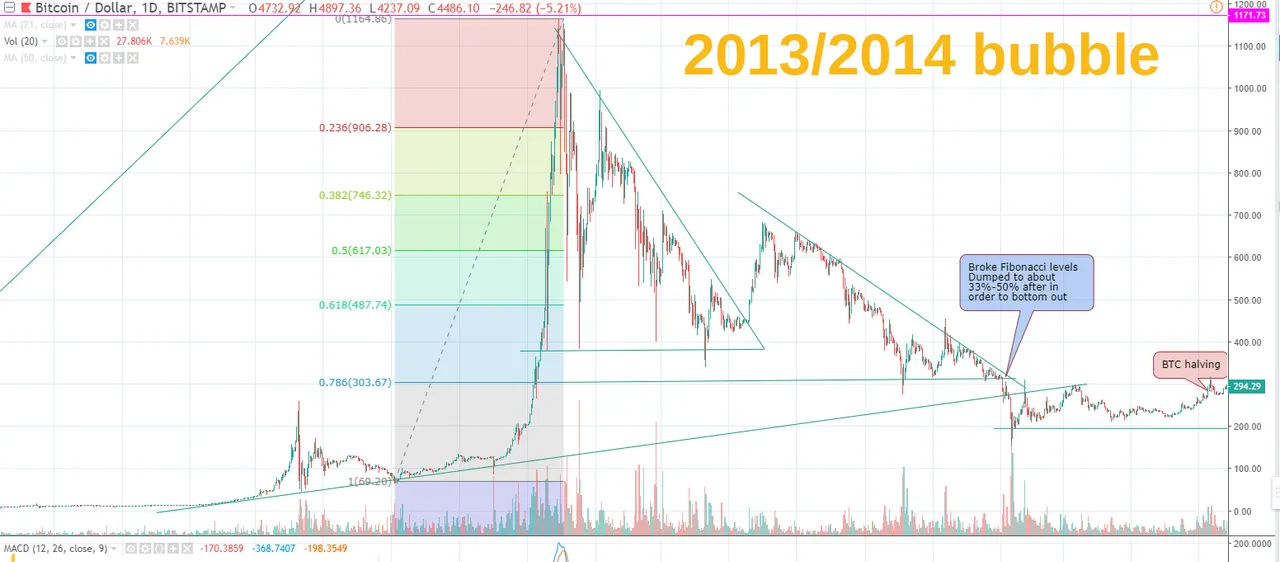
As you can see, last time we capitulated over the final Fibonacci level and we eventually managed to find a bottom about 33-50% lower, depending on whether you want the absolute bottom or the 'more or less' bottom. The absolute bottom is somewhere around $160 and the average bottom where we hung out for a year was about $200-220. I am expecting a similar resolve this time around. For comparison's sake let's bring up today's chart with the same fibonacci levels:

As you can see we have just broken through the Fibonacci levels, at about $4300 which I have set up as my first buy-in point. If we bottom out at the same percentage(s) as last time around we can expect a drop of 33% to about $3000 and possibly a downward spike to the absolute bottom at 50% somewhere around the $2000 level in which case the $1850 support level seems best place since it shares support levels with previous support.
I believe $3000 in 2018/2019 is the new $200 that we saw in 2014/2015. If you were lucky last time, you could've even gotten Bitcoin as low as $160. This time around we may see similar chances with short, momentary downward spikes that breach the $3000 level. If you're able to catch these then lucky you. If not then long-term $3000 seems like a great place to buy in. Not only does it match my fibonacci theory, but it is also heavy support from last summer where it functioned both as a ceiling as well as a price floor before. $3000 will be heavily defended, and I expect that for the next year we will see the price around this level quite often.
How long?
All in all I don't expect to hit the absolute bottom for quite a while. We may rush down quickly but usually these scenario's take a few months to play out. Just look at the monthly chart's MACD indicator. Based on that it is pretty obvious to me that the bear market is only 50% through. By Q2 2019 there is a good chance we will finally start some kind of reversal.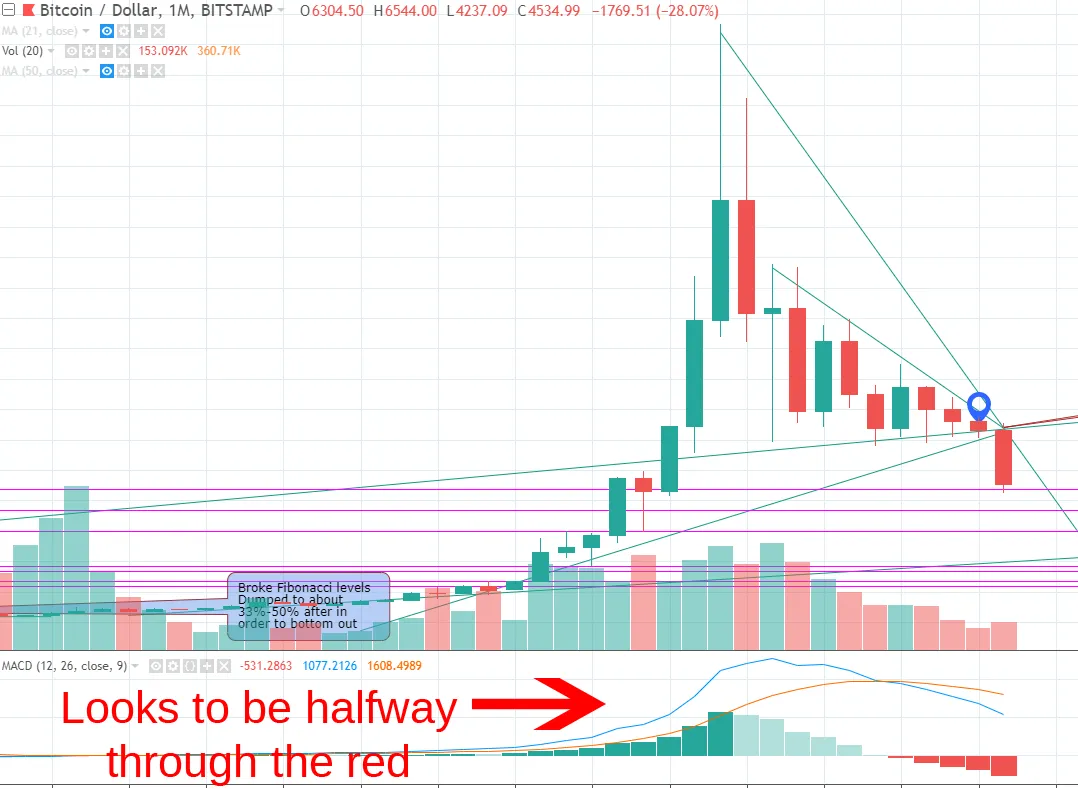
Note by the way, how finally we are showing increased volume on the monthly MACD chart too, which further indicates that we are in the capitulation phase which is necessary in order to advance. This is a good sign. More red ahead first though!
If you are still hodling, congratulations or condoleances or both! You've now graduated into the ranks of Veteran HODLers. If the only reason you're still holding is because you're 90% down and what's left is not worth cashing out anyway, then congratulations: this is how many HODLers are born. It happened to me too, last time around. Keep the faith, hodl strong and don't let the bad whales scare you - this is the true rollercoaster that is Bitcoin and rollercoasters can be scary if they go down really fast.