However, the market is still within my wave count presented here 27 days ago. What has changed since then is that now it doesn't look so far fetched as it might have been when it was first made publicly available. There are some other changes that need to be pointed out to bring the technical outlook up to date.
First, 89 weeks WMA has risen slightly above the minimum achieved on the 6th of February and it currently coincides with the weekly downside trigger line @ $5828. So, we are looking at the strong support at this very level.
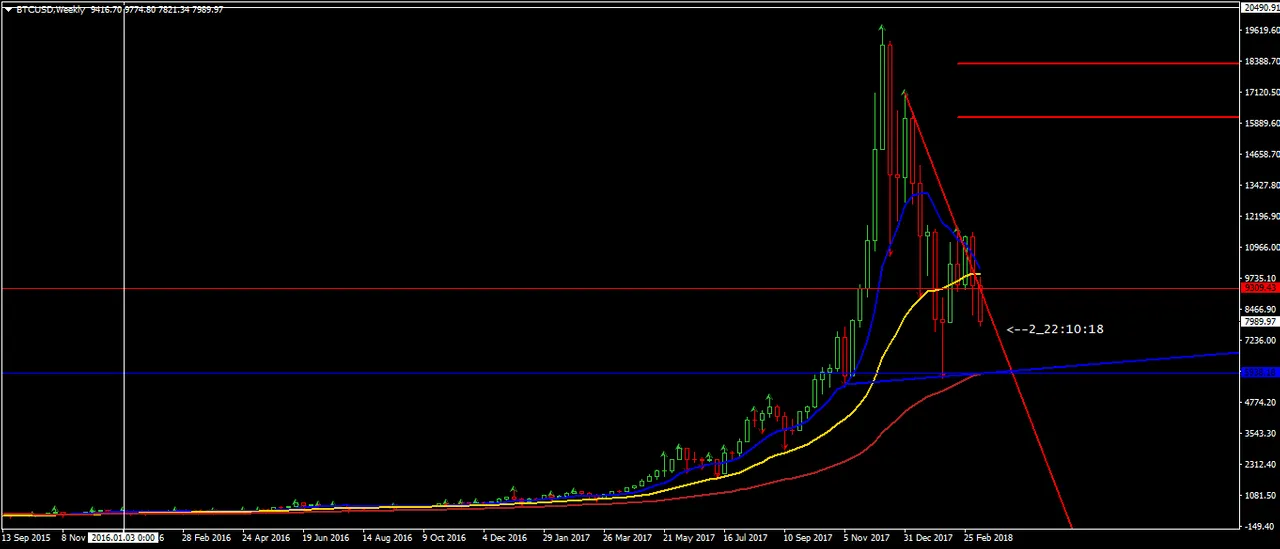
https://www.mql5.com/en/charts/8439300/btcusd-w1-simplefx-ltd
Secondly, all 3 major daily WMAs turned negative confirming the bear market on the daily time frame. As far as the volatility targets are concerned we have reached the first one @$7876 and since BTC looks very heavy there's no doubt in my mind that we will reach the second volatility target @$7104 in virtually no time. I even don't exclude a capitulation all the way down to 89 weeks WMA (white dotted) @5828 where I expect the market to stabilize and find support.
https://www.mql5.com/en/charts/8439346/btcusd-d1-simplefx-ltd

Since all major ALTs follow Bitcoin they will find support together with it.