
Bitcoin is in bearish mode from the last all times height and an bearish market pattern just don't want to go away. Everybody now discussing about where price will turn north again.
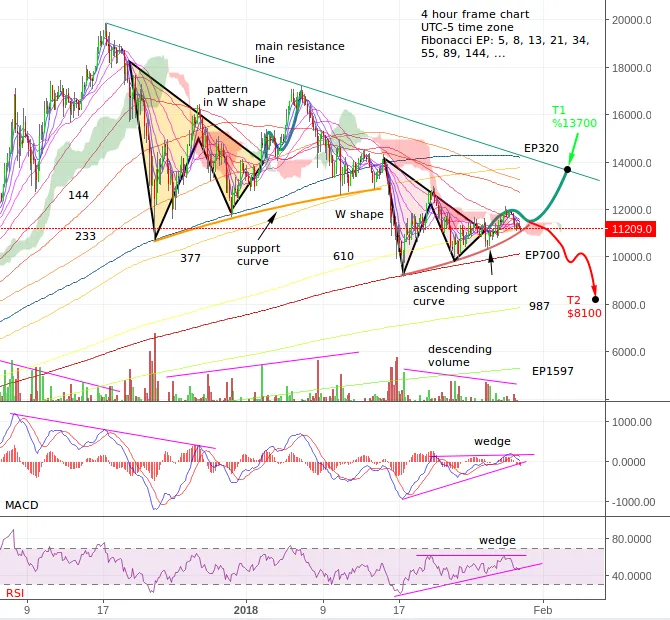
I find some interesting patterns and similarities on chart above. In the beginning of this year Bitcoin price formed interesting pattern in W shape. It seams that now we are in a local price minimum and it is heading north for a while.
I spot two interesting W shape patterns or fractals which are similar in shape. Lately i found out that on my charts with equiv potential lines that overall this type of pattern triggers a uptrend move in 66% of cases. It is a little more reliable in uptrend than than in a downtrend movements of price.
Price is confined between EP320 and EP700 equiv potential lines and trading is conducted in this dynamic channel for two weeks now. When price starts to penetrate this channel in December a descending support curve (in orange) is formed, but ascending volume picks had formed in that period. In latter period we have ascending support curve and descending volume.
In former case W shape pattern produce a uptrend rally to the main support line and is likely that in latter case something similar will happen. wedges in MACD and RSI indicators support price ascend and volume decreasing is against the ascend. I bet on moving price to the target T2 = $13700.
This W shapes work similarly as double tops or bottoms except dips in pattern must be compared to the first lower EP line. In classical TA we assume that dips and picks are on the same potential (horizontal line) but I think that moving averages as equiv potential lines describe price potential better, in overall uptrend market as Bitcoin is at the moment. So in ascending market two picks from which first is lower then the second, have same potential according to the equiv potential lines and opposite is valid in overall descending market.
I decide not only predicting price movement but also start a small portfolio currently consisted from three coins: BTC, LTC and DASH. Some more will be added latter when good buy opportunities arise.
BTC: price=$11950 amount=$15
LTC: price=$200.00 amount=$15
DASH: price=817.89 amount=$15
Let trade this portfolio together and learn some interesting stuff in crypto trading. I'm open for your suggestions and remarks in comment section of this blog.
Don't forget to check out this new TFDSRE thing Elliott waves are not the only thing, you can surf on: #1, #2, #3, #4.
Previous analysis: #22, #23, #24, #25, #26, #27,#28. Is good to check them out to get insight into my reasoning.
Image sources: Investing.com,
Data sources: Bitfinex exchange
Disclaimer: If you use my ideas and analyses in your investment ventures, you take all responsibility and consequences about your actions.
What do you think about BTC price? Comment and present your views! Great ideas emerge from good quality discussion! I'll be immensely grateful for your contribution.
Check also technical analyses from TAF squad: @pawsdog, @futuristgear, @exxodus, @allthereisislove, @lordoftruth, @ew-and-patterns, @toofasteddie, @gazur.
And as always upvote this post and previous ones, if it have some value, follow me, if you think this content is great and I promise that it will be more interesting stuff in the future. Let steem on, to the bright future!