
Summary:
Ethereum is one of the most popular crypto currency after bitcoin and stands 2nd in ranking with around $81,107,964,800 Market cap. It has been in correction lately and looks like its not over yet.
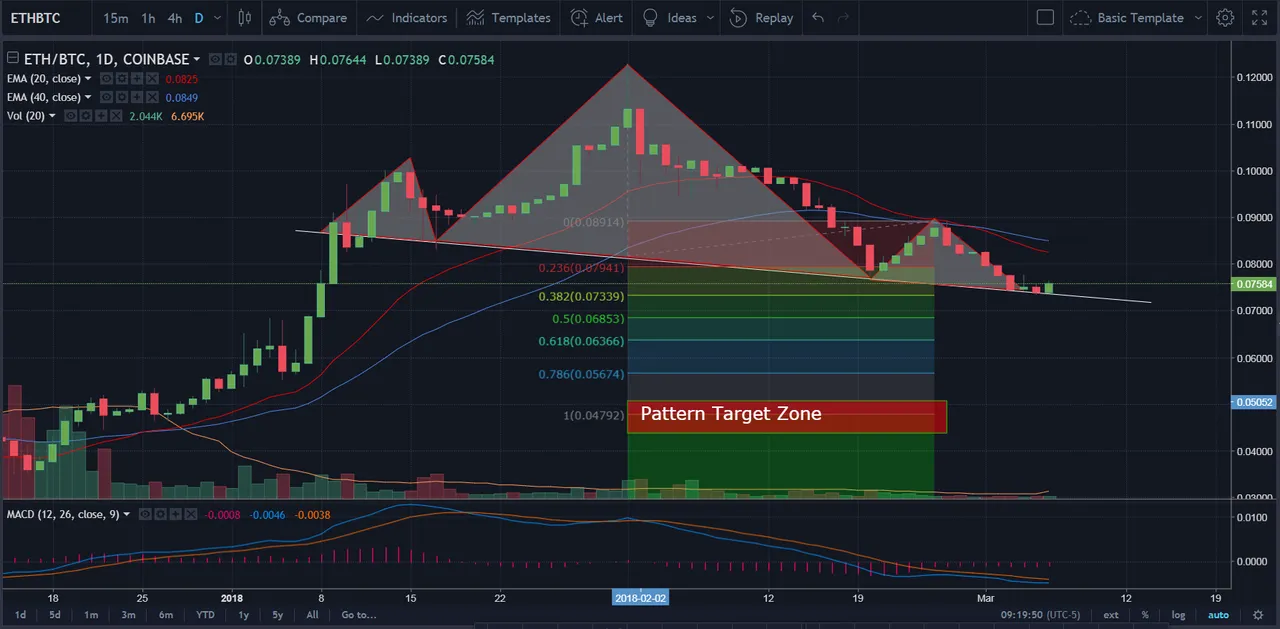
Pattern Analysis: ETHBTC
ETH/BTC pair show a Head & Shoulder formation on day chart with a inclined neckline. Pattern target zone to the downside is 0.049 - 0.043 BTC.
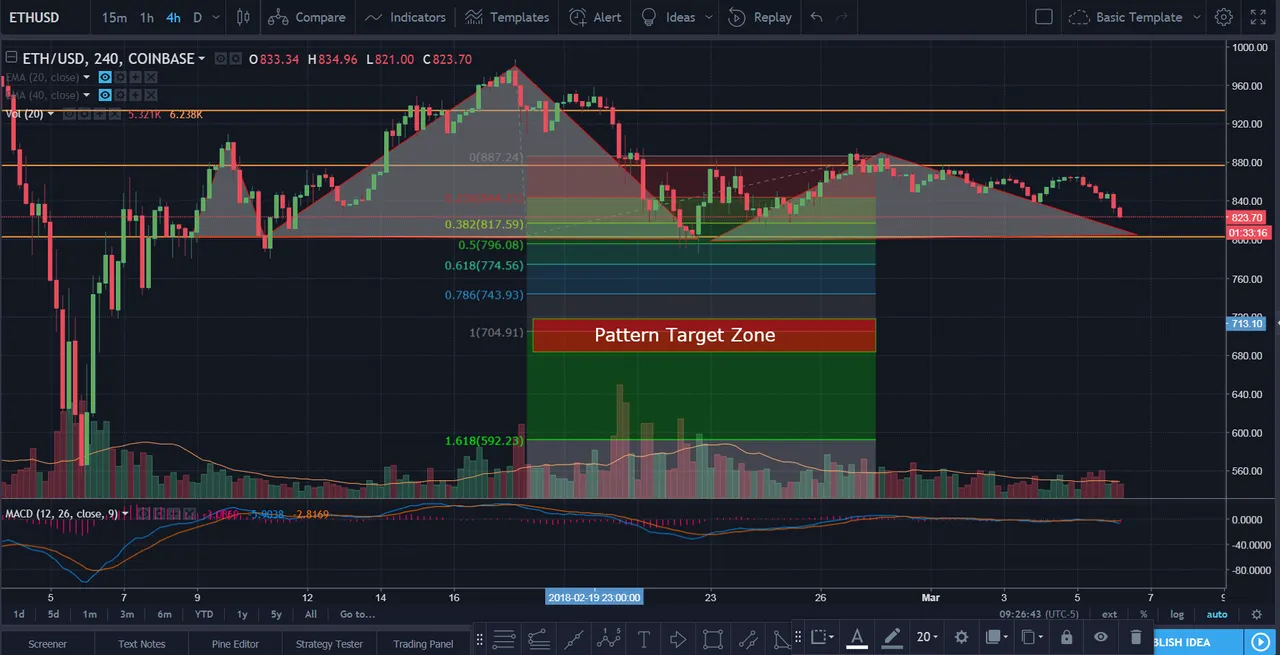
Pattern Analysis: ETHUSD
ETH/USD chart also show H&S pattern but is still in formation of right shoulder with neckline at 803ish level, which us a downside target of 703ish level. Volume has been on the lower side these days on ETH and more indications to the downside are getting stronger.
If you like this post please upvote, follow and Resteem this post, You can also follow me on twitter to get instant updates @tradewithtechie
Disclaimer:
I am not a financial advisor, nor the information posted in this article is a financial advice. The information in this article is my personal opinion and is not recommended to make any investment transactions based on it. I do not take any responsibility for the investments made based on my analysis.
