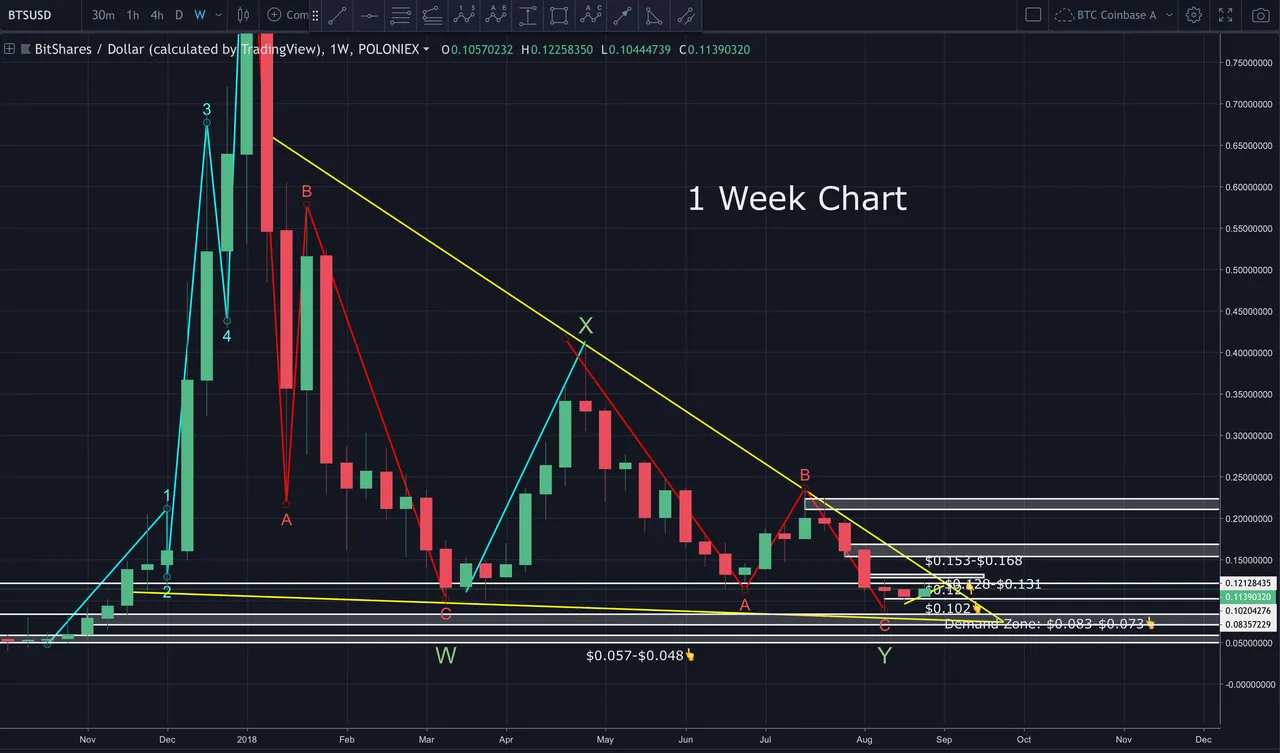
BitShares is reaching the apex of the larger wedge its been operating in for the last 8 months. This suggests a larger move may be coming.
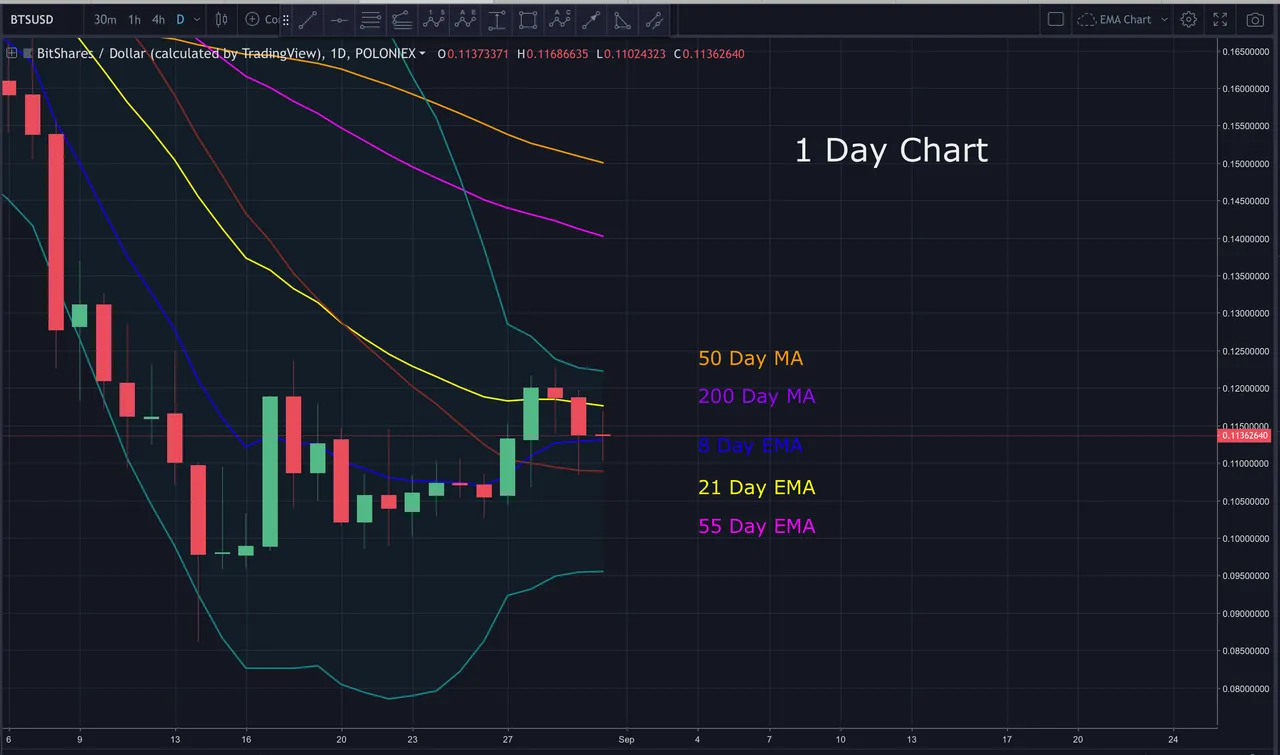
Zooming in on the 4 hour chart, we can see price has been rising along an ascending support line. It’s approaching a very strong $0.12 resistance, as well as the descending resistance of the larger wedge. Either the support or resistance will break in the next few days.

If price breaks down, I believe it’ll find support at about $0.10. Looking up, there’s a small supply zone (resistance) between $0.128 and $0.131. If price breaks up, I believe it’ll initially consolidate in this area.
Looking at the 1 day chart, we see price dropped below the 21 day EMA and is finding support on the 8 day EMA. The 8 day EMA needs to hold, in my opinion, to remain bullish.
In today’s video analysis, I discuss price movement in the short term, possible trade entry points, traps to avoid and MUCH more information not found above.
Video Analysis:

If you’re viewing this on a site other than Steemit, and you don’t see the above video, navigate to Steemit or TIMM (https://mentormarket.io/profile/@workin2005?aff_id=Workin2005) in order to watch.
BIAS:
Short Term: Neutral
Longterm: Bullish
I hope this has been helpful. I’d be happy to answer any questions in the comment section below. Until next time, wishing you safe and profitable trading!
Workin
If you found this post informative, please:

Open an Account on Binance here:
https://www.binance.com/?ref=16878853
Support the Crypto Ecosystem with Brave Browser:
https://brave.com/wor485
Twitter handle is @Workin2005 and Facebook is https://www.facebook.com/Workin2005
Published on

by Workin2005