Your Quick Guide to Spotting Crypto Trade Setups Using Trendlines
Heard about making money trading crypto but find those charts confusing? Let's simplify one popular technique shown in the video – using trendlines to find potential entry points. Think of it like drawing lines on a map to see where the price might go next.
Here’s your step-by-step guide:
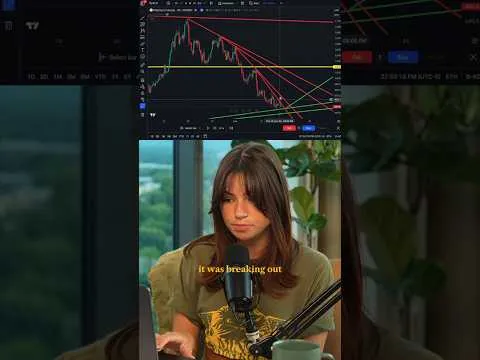
- Open a Chart: Pick a cryptocurrency you're interested in and look at its price chart. The video used a 4-hour timeframe, which shows price movements over several days. You can start by looking at this timeframe on a charting platform.
- Find the Recent Highs and Lows: Look at the recent price action. Can you see a pattern of peaks (highs) generally moving downwards? Or a pattern of valleys (lows) generally moving upwards?
- Draw Your "Boundary Lines":
- If the highs are trending down, draw a straight line connecting two or more of those peaks. This is your upper boundary (like a ceiling).
- If the lows are trending up, draw a straight line connecting two or more of those valleys. This is your lower boundary (like a floor). You might see both on the same chart, like in the video!
- Watch for a "Breakout": Now, you wait patiently. A breakout happens when the price clearly moves past one of your boundary lines and stays there.
- If it breaks above the upper boundary line, it could be a signal the price might go higher (a potential "buy" signal or "action line" as the video called it).
- If it breaks below the lower boundary line, it could signal the price might go lower (a potential "sell" or "short" signal).
- Set Your "Safety Net": Trading involves risk! Before you even think of entering a trade, decide where you'll cut your losses if the price goes the wrong way. The video suggests using the opposite boundary line as your guide.
- If you entered because the price broke the upper line, you might set your safety exit (stop-loss) just below the lower line.
- If you entered because the price broke the lower line, you might set your safety exit just above the upper line. The idea is that if the price goes back across the other line, your trade idea might be wrong.
- Confirm the Break (Optional but Smart): Sometimes the price briefly pokes through a line and comes back. Many traders wait for the price period (like the 4-hour "candle" on the chart) to finish or "close" beyond the line before acting. This helps avoid fake signals.
- Make Your Move (If It Fits Your Plan): If you see a confirmed breakout and you've planned your safety net, now you might consider entering a trade based on the direction of the break. Remember, only risk money you can afford to lose.
This is a simplified look at one strategy. Real trading involves more, like understanding risk management and market conditions. But learning to spot these basic patterns is a great first step!
Want more easy-to-understand crypto guides? Follow for more tips!