Hello this is the first of my series of posts on crypto currencies insights using data science. As an introduction, I am a Computer Engineering graduate major in Data Science and have been using Data to come up with predictive models and insights since the past 5 years now. I have worked across multiple domains including Finance, healthcare and social networks.
Since April, 2017 during a discussion with my friends on investment options crypto-currencies caught my eye and since then I have been actively investing and learning about crypto-currencies and ofcourse the phenomenal rise of Bitcoin. I had my share of fun during the bull market but as a Finance guy I was looking for a correction in the hind-sight and now when we see a bear(ish) market I am looking to share some insights using some of the cool stuff I have learnt in data mining.
To begin with lets look at the distribution of the gains (current close / previous day's close) across days of the week in 2017. 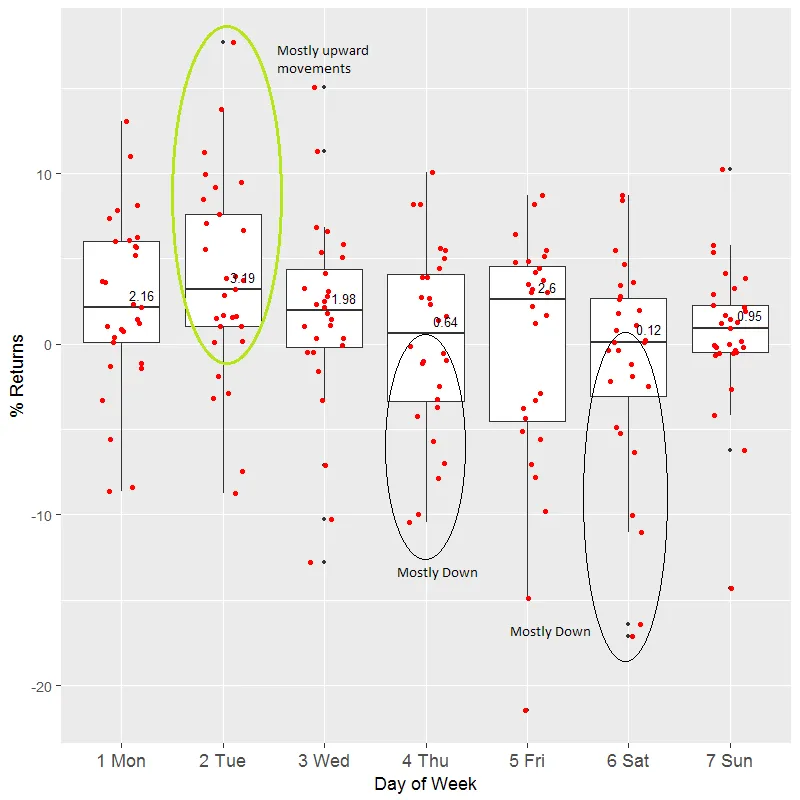
What do we see here - on Thursdays and Saturdays we almost always see a dip in the bitcoin price ( 0.64 and 0.12 median values)
And in contrast on Tuesdays we almost always observe solid gains.
Lets look at a similar chart with data from 2016. 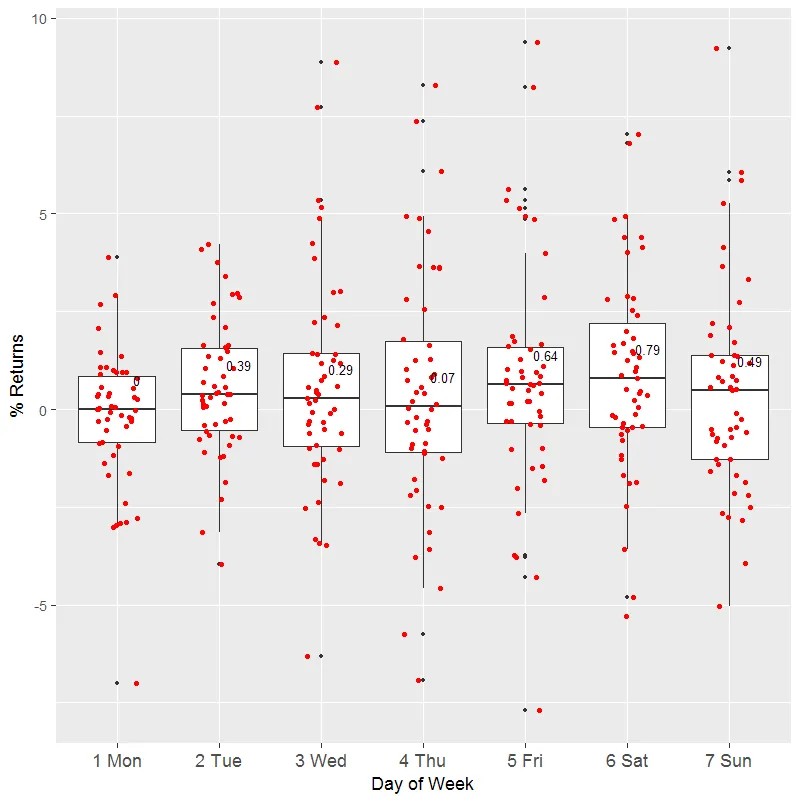
We observe lower volatility in 2016 with almost no dips during weekends (the market has become more notorious) but another interesting observation is the Thursday dip again. I wonder what is happening on Thursdays
So basis the above 2 chars let us define a crypto week which starts on a Thursday and ends on a Wednesday. An important information for investors here will be to know about cryptos which have negative correlation with BTC.
As a part of my crypto analysis series I will be posting the correlation charts to help investors make informed decisions an not fall for FOMO or FUD ( Pretty standard terms in cryptoverse if you don't know about these do read)
So coming to this weeks chart (06- 12th July)
The chart shows correlation across crypto-currencies. I am looking at top 15 only since the rest is just noise and Pump and Dump) Pairs which are negatively correlated are colored "red" and positive correlation is colored "blue" with the darker shades indicating the scale.
![[Jul6-12].png](https://images.ecency.com/p/2FFvzA2zeqoVZ5NRzV2o8MyJEzowAL6rjbt8w3dTGU9EJhYTRwM8Tkhkgk4TdNU3vJL3ek6TTzi51mYh4hLRidhXaRDCoJRmZ85KNZ4EeziKhBA6bLbrqRBwsj1Bt.png?format=match&mode=fit)
If we look at the current weak BCC ( BitConnect Coin) is negatively correlated with Bitcoin which makes it a research candidate for me. Among the higher market cap coins Litecoin is loosely correlated with Bitcoin price followed by ETC,XEM and XMR). Investing in these currencies can be a good hedge against bitcoin price when it is falling. On the other side of the spectrum ETH , XRP ,Waves, STEEM and ANS are almost 90% correlated with Bitcoin price and it won't be a good idea to invest into these when the price is falling. The LTC-BTC , ETC-BTC Charts also support this observations.
Look at how the ETC-USD pair held value when ETC-BTC was falling 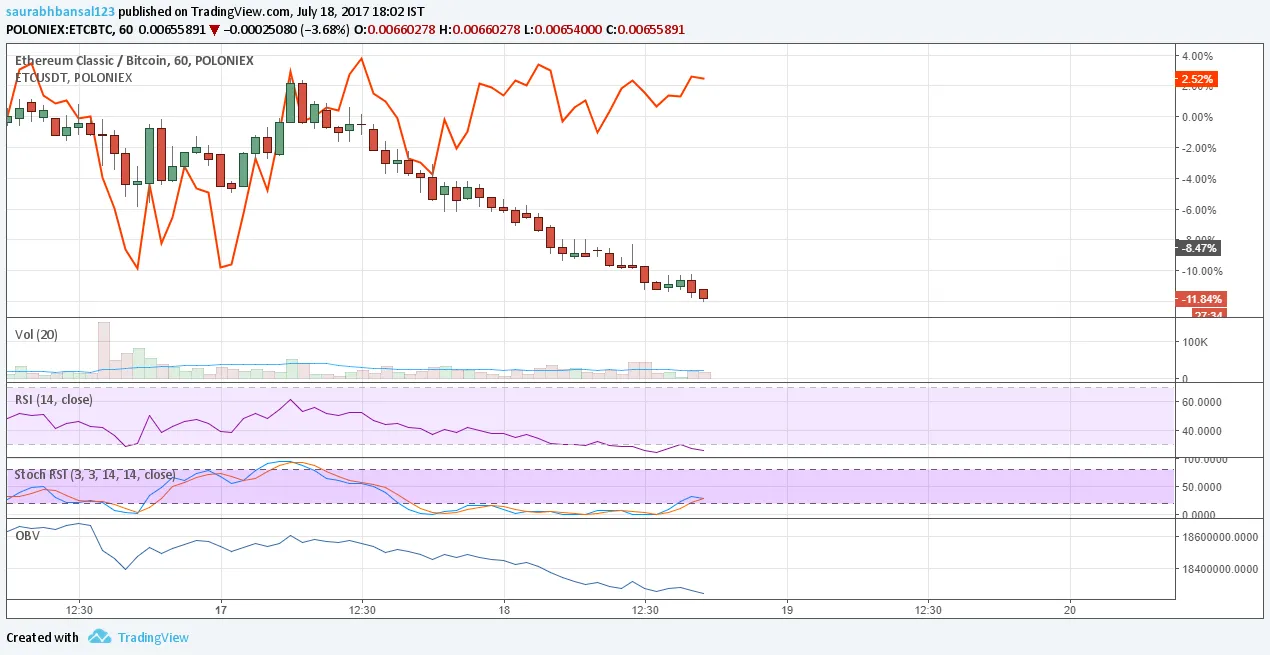
And so did the LTC-USD pair 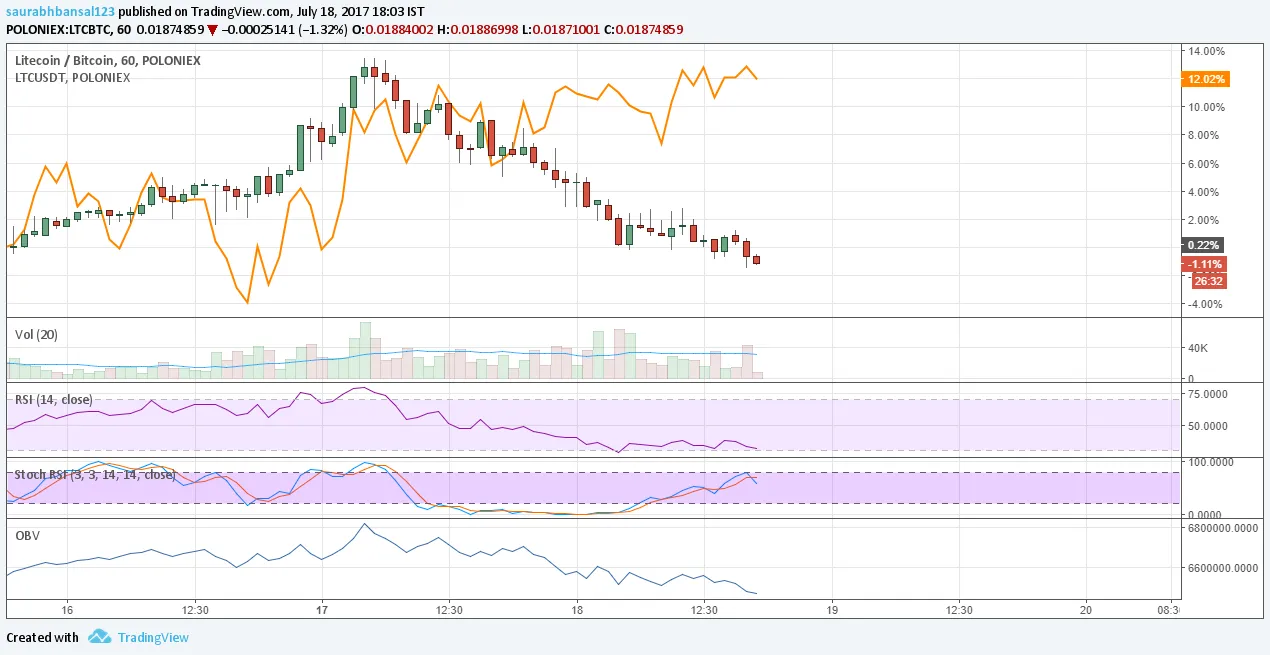
As a concluding remark I'd say there is a lot of interesting stuff to be unveiled in the cryptoverse and the correlations are too statistically significant to be attributed to noise. Please share your views on my analysis and feel free to upvote/subscribe my post if you gained anything from this. Also comment on the elements which require more clarity or something which you would like me to cover in the next edition.
Feel free to refer to my standard Technical Analysis(TA) ideas on trading view
NOTE: The contents of the post are in no way to be considered as investment signals. Please do you own due diligence before investing in crypto and never invest more than you can afford to lose. Remember its not a lottery but investment.