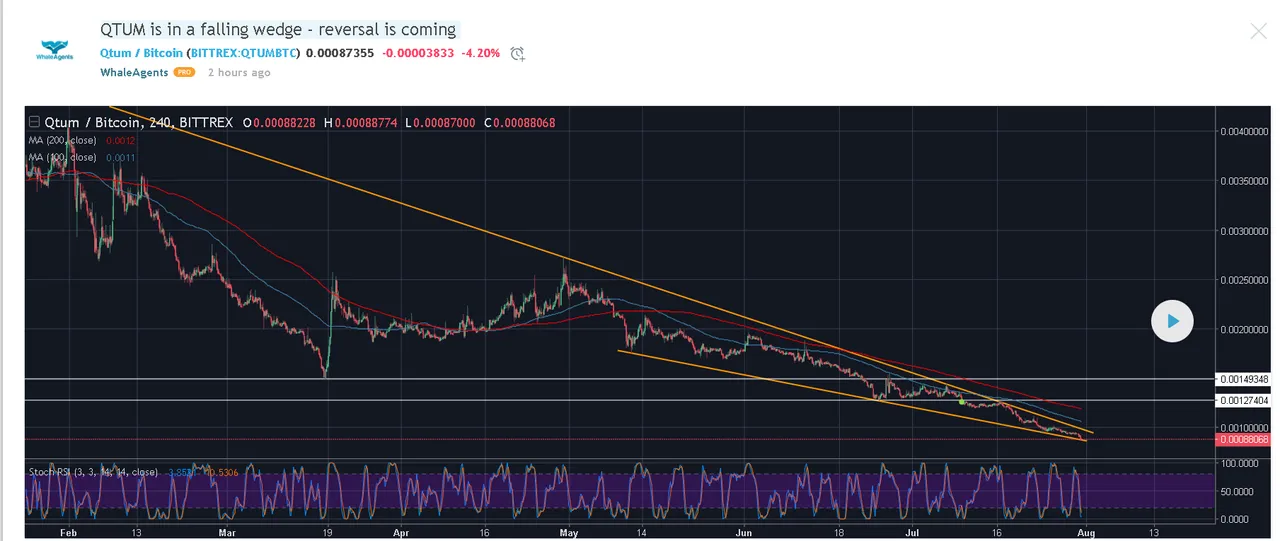
Seven months have passed since QTUM entered a downtrend on the higher timeframe. The series of lower highs and lower lows has created a falling wedge and trapped the price action within it. A falling wedge is a reversal pattern. As a reversal signal, it is formed at a bottom of a downtrend, indicating that an uptrend would come next. The price action stays trapped for a longer period of time within the wedge and a huge amount of energy is accumulated, waiting for the price to break out of the wedge and collect all stops. In addition, the RSI on the H4 chart is deeply oversold, which adds more weight to the potential bounce in the coming days. If the price breaks the wedge and starts rallying, look for a test of both 100 and 200 MAs on H4 chart as well as two horizontal resistance levels that acted as support in the past. The coin is so oversold that a potential reversal offers a great R:R for the traders. Any long position must be protected with a stop beneath the wedge support.
➖➖➖➖➖➖➖➖➖➖➖➖➖➖➖➖➖➖➖
🌐 FREE Cryptocurrency Signals
🌐 Follow us on Twitter
🌐 Visit our Official Website
🌐 About WhaleAgents
🌐 Original post in our Tradingview profile
➖➖➖➖➖➖➖➖➖➖➖➖➖➖➖➖➖➖➖➖