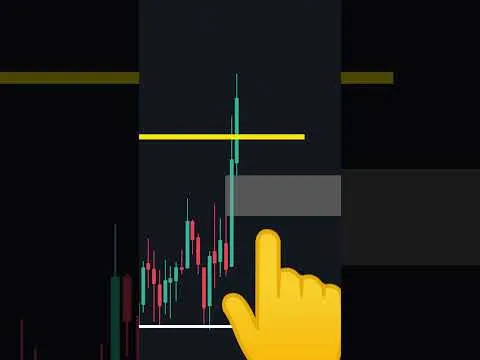
Your Simple Guide to Finding Crypto Sell Points Using Fibonacci on TradingView
Ready to learn a simple trick traders use to figure out when to sell their crypto for a potential profit? This guide uses a tool called Fibonacci retracement on TradingView, a popular charting platform. Let's break it down step-by-step!
Step 1: Get TradingView Ready
- You'll need access to TradingView (they have free plans).
- Open a chart for the crypto you're interested in.
Step 2: Set Up Your Fibonacci Tool
- Find the Fibonacci Retracement tool (usually on the left-hand side panel).
- Click the settings icon (looks like a gear ⚙️).
- Change the levels to these specific values:
- 1
- 0
- -1
- -2
- -2.5
- -4
- Make sure only these levels are checked/active. You can customize colors if you like – the video uses red for the -2 and -2.5 levels.
Step 3: Spot the Pattern on Your Chart
- Look for a "liquidity sweep": This is where the price dips below a recent low point and then quickly bounces back up. Think of it like grabbing orders hiding below that low.
- Wait for a "break of structure": After the sweep, watch for the price to push above a recent high point. This shows the upward bounce has strength.
- Find your entry (optional but good practice): Look for a "fair value gap" (often a large single candle creating a gap between the candles before and after it) where the price might pull back to before continuing up. The video shows entering the trade here.
Step 4: Draw Your Fibonacci Levels
- Select the Fibonacci tool you set up in Step 2.
- Click on the lowest point of the liquidity sweep (the bottom of that dip).
- Drag the tool up and click on the highest point reached during the break of structure.
Step 5: Identify Your Take-Profit Zone
- Look at the lines your Fibonacci tool just drew on the chart.
- The zone between the -2 and -2.5 levels (the red zone in the video's example) is your target area to consider selling and taking profit.
- Why this zone? This strategy suggests the price often reaches this area after the pattern you spotted in Step 3.
- Bonus Tip: The video mentions this zone is even stronger if it lines up with other resistance levels (like previous highs on a longer timeframe chart).
Step 6: Manage Your Trade
- The video also shows setting a "stop loss" below the low point of the pattern (the entry area) to limit potential losses if the price goes the wrong way.
- Now, you watch and see if the price reaches your target zone!
And that's it! You've used a specific Fibonacci strategy to find a potential take-profit zone. Remember, no trading strategy is foolproof, but learning tools like this can help you make more informed decisions.
Like this simple guide? Follow for more easy-to-understand crypto tips!
