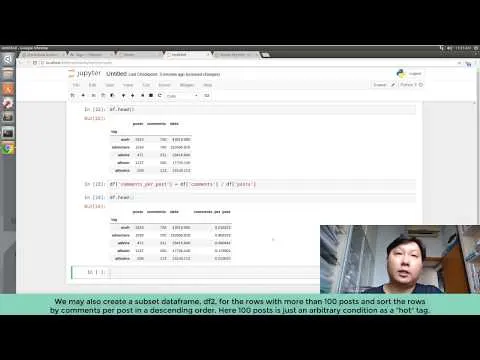
The final part of the video tutorial series, we continued to use pandas to find out the top 10 tags and quickly made a data visualization chart. Although the narration is in Cantonese, I added English subtitle for your convenience.
Please feel free to comment. Thank you very much!