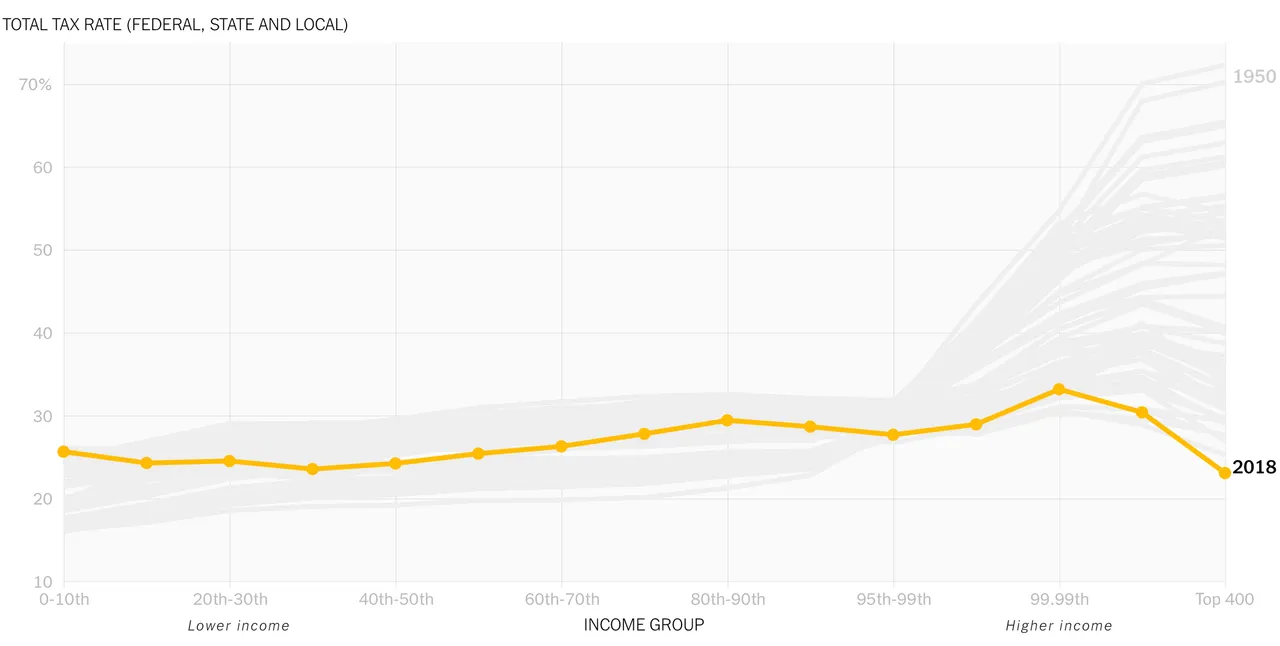
I'm writing about the tax visualization published at https://www.nytimes.com/interactive/2019/10/06/opinion/income-tax-rate-wealthy.html. Not only is this an excellent example of data visualization, it is so because of the story it tells. Up until the Reagan tax cuts, the average tax rate was very progressive: the rate rose with income. Then, rates fell across the board, especially for the 400 taxpayers with the highest incomes. By 2011, the Clinton tax increases create an effectively flat tax. The Bush tax cuts again favored the wealthiest taxpayers. Then, the Trump tax cuts dramatically favored the wealthiest.
My only qualm is that the data show only gross taxes: money paid to the government. They don't account for transfers: payments from the government to taxpayers. These include welfare payments and government health care expenditures. Including these would show the more accurate net tax rates. The poorest may actually have negative net tax rates, showing that they receive money from the government (really, other taxpayers)!