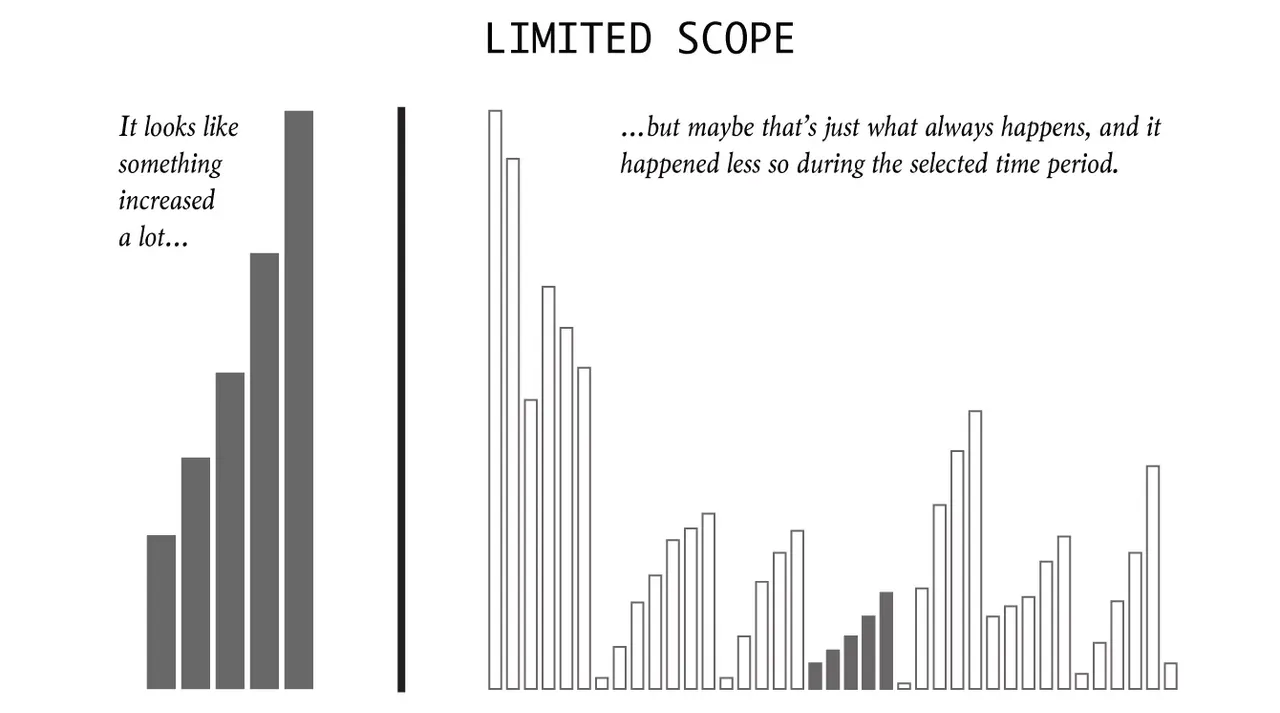
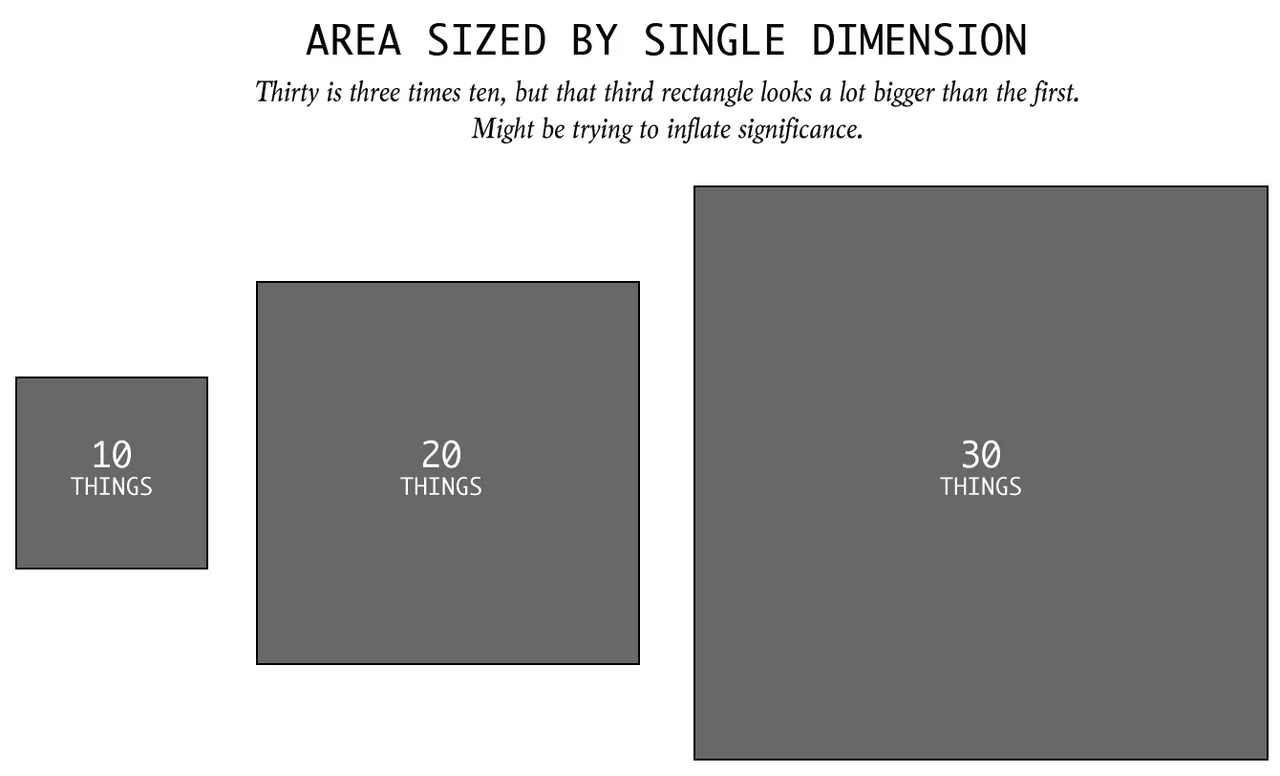
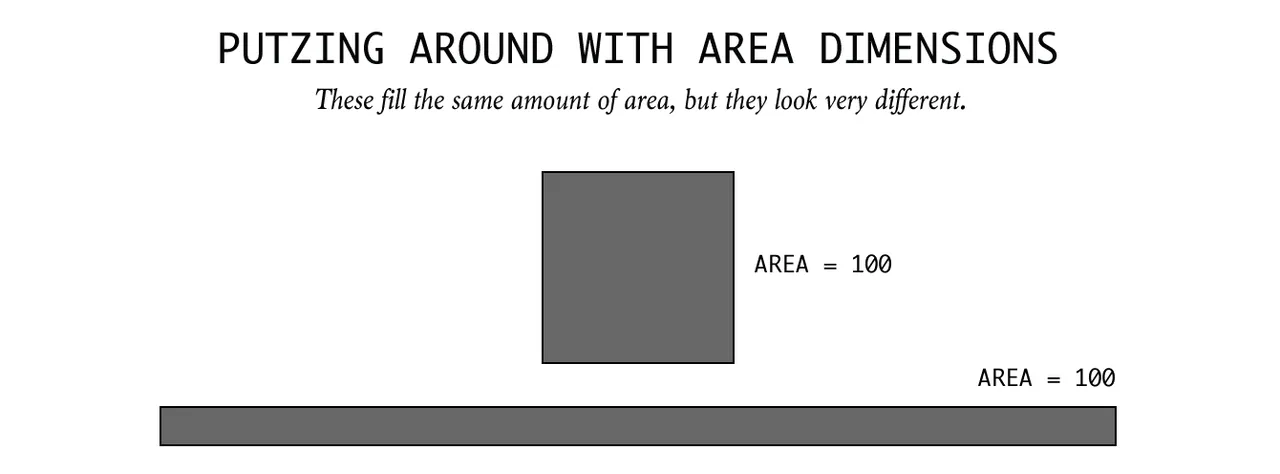
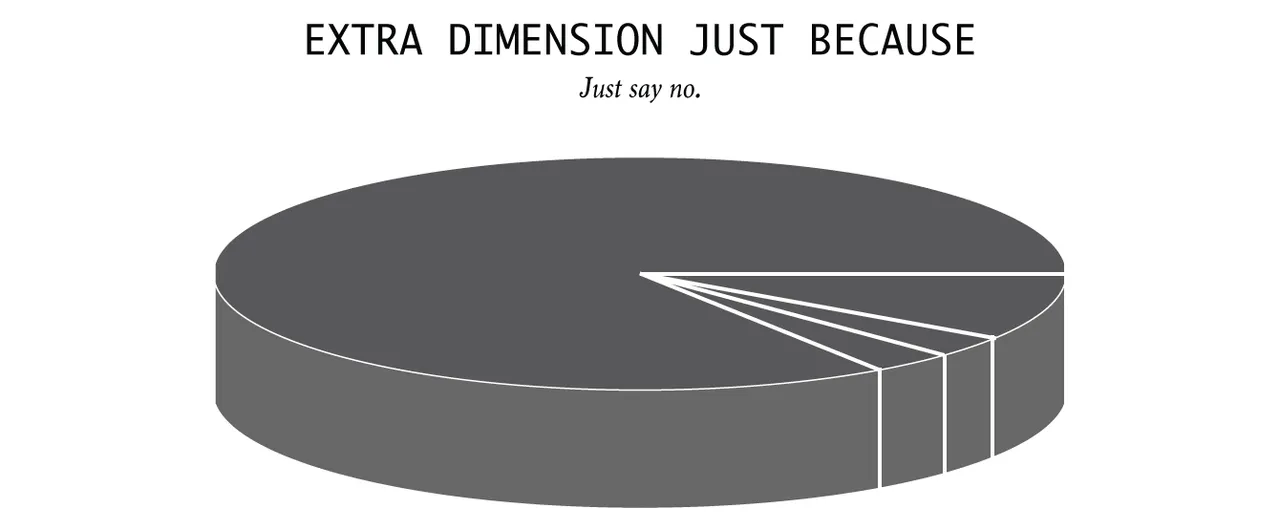
My favourite 101 collection on how to see through data visualisation trickery, thereby giving you a good set of "rules of thumb" to look at data properly. If you're really into it, there's an oldie, but goody book called "How to Lie with Statistics". https://en.wikipedia.org/wiki/How_to_Lie_with_Statistics
Credits for this fun walkthrough go to Nathan Yau of FlowingData.
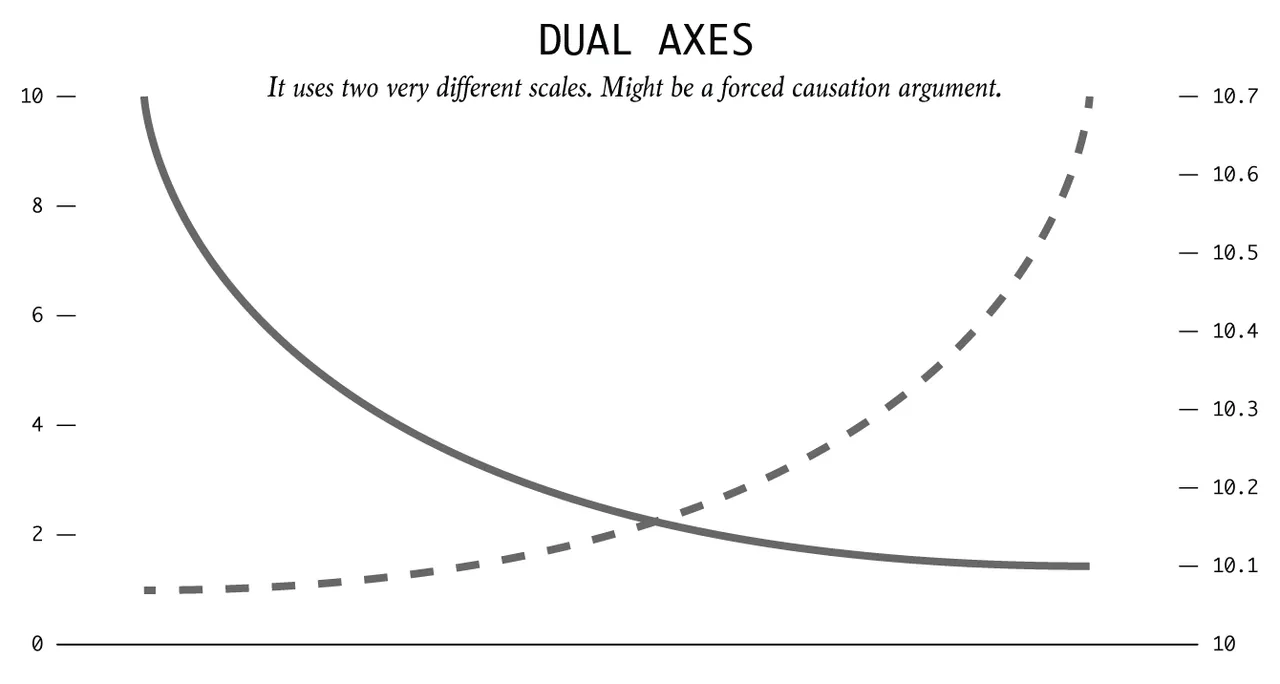
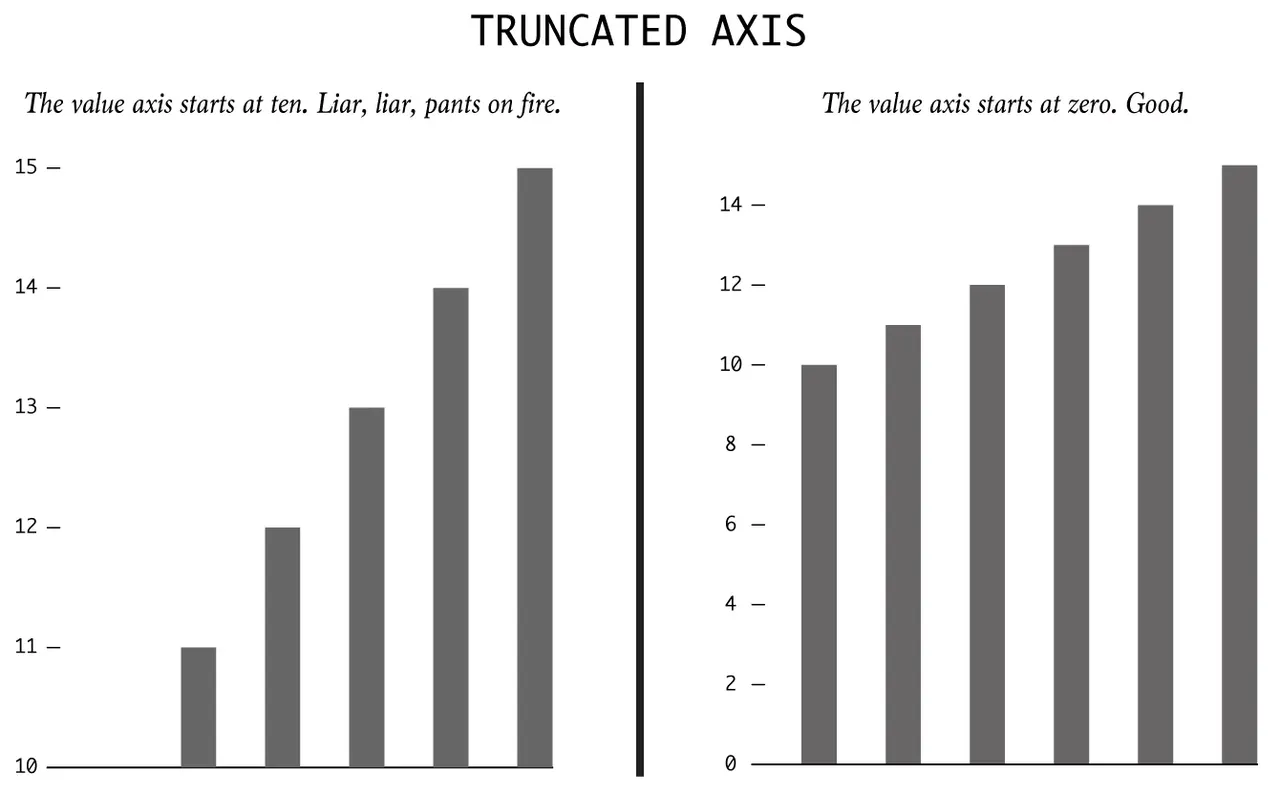
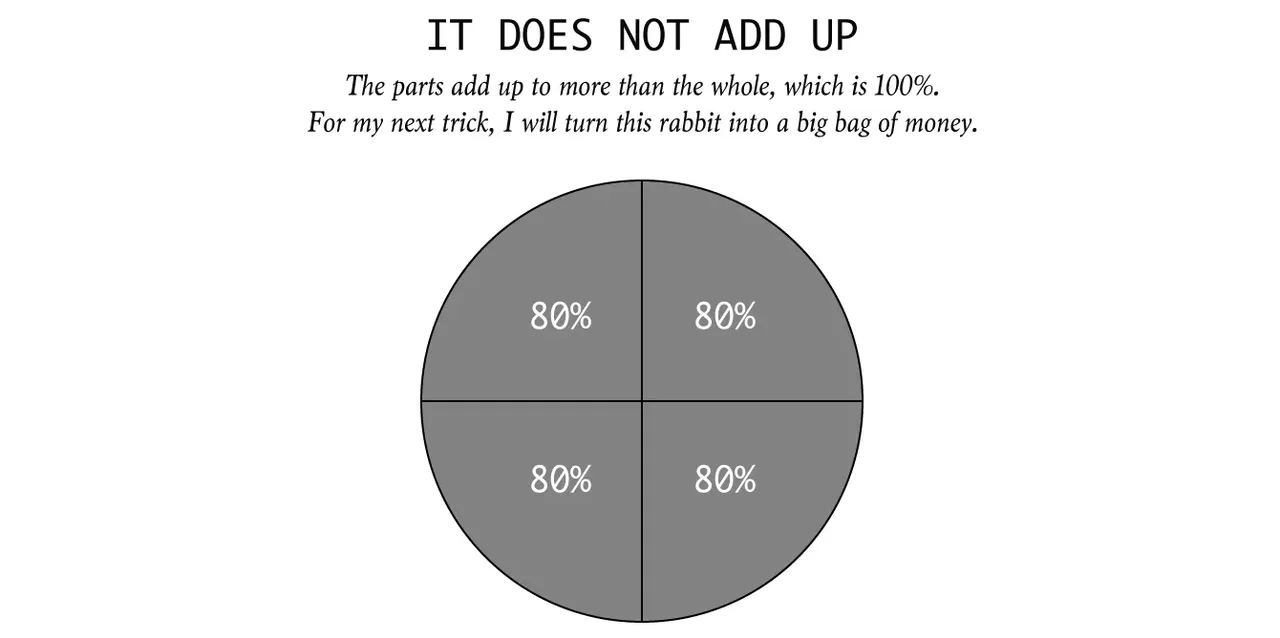
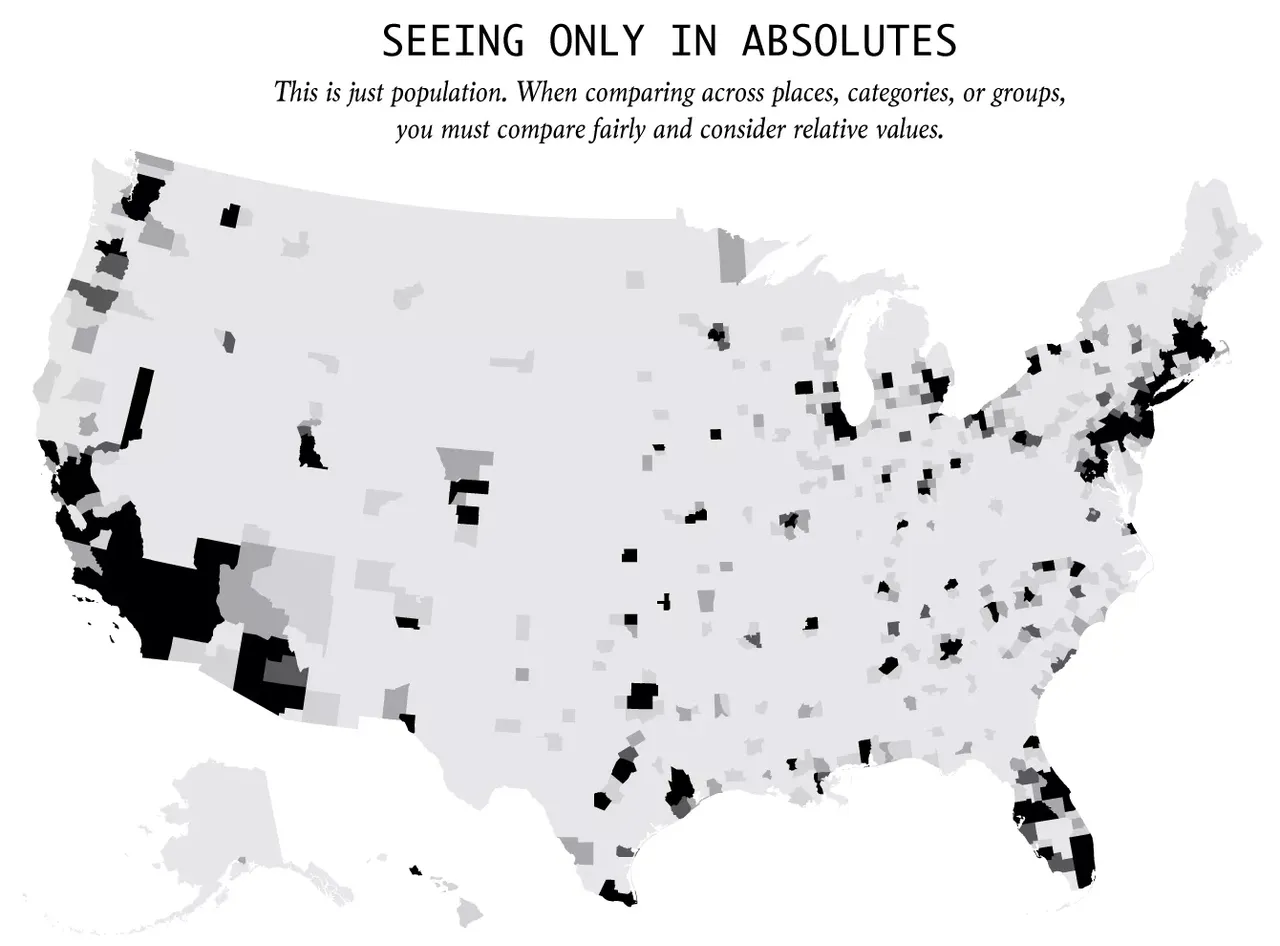

Full article: https://flowingdata.com/2017/02/09/how-to-spot-visualization-lies/