1 Month
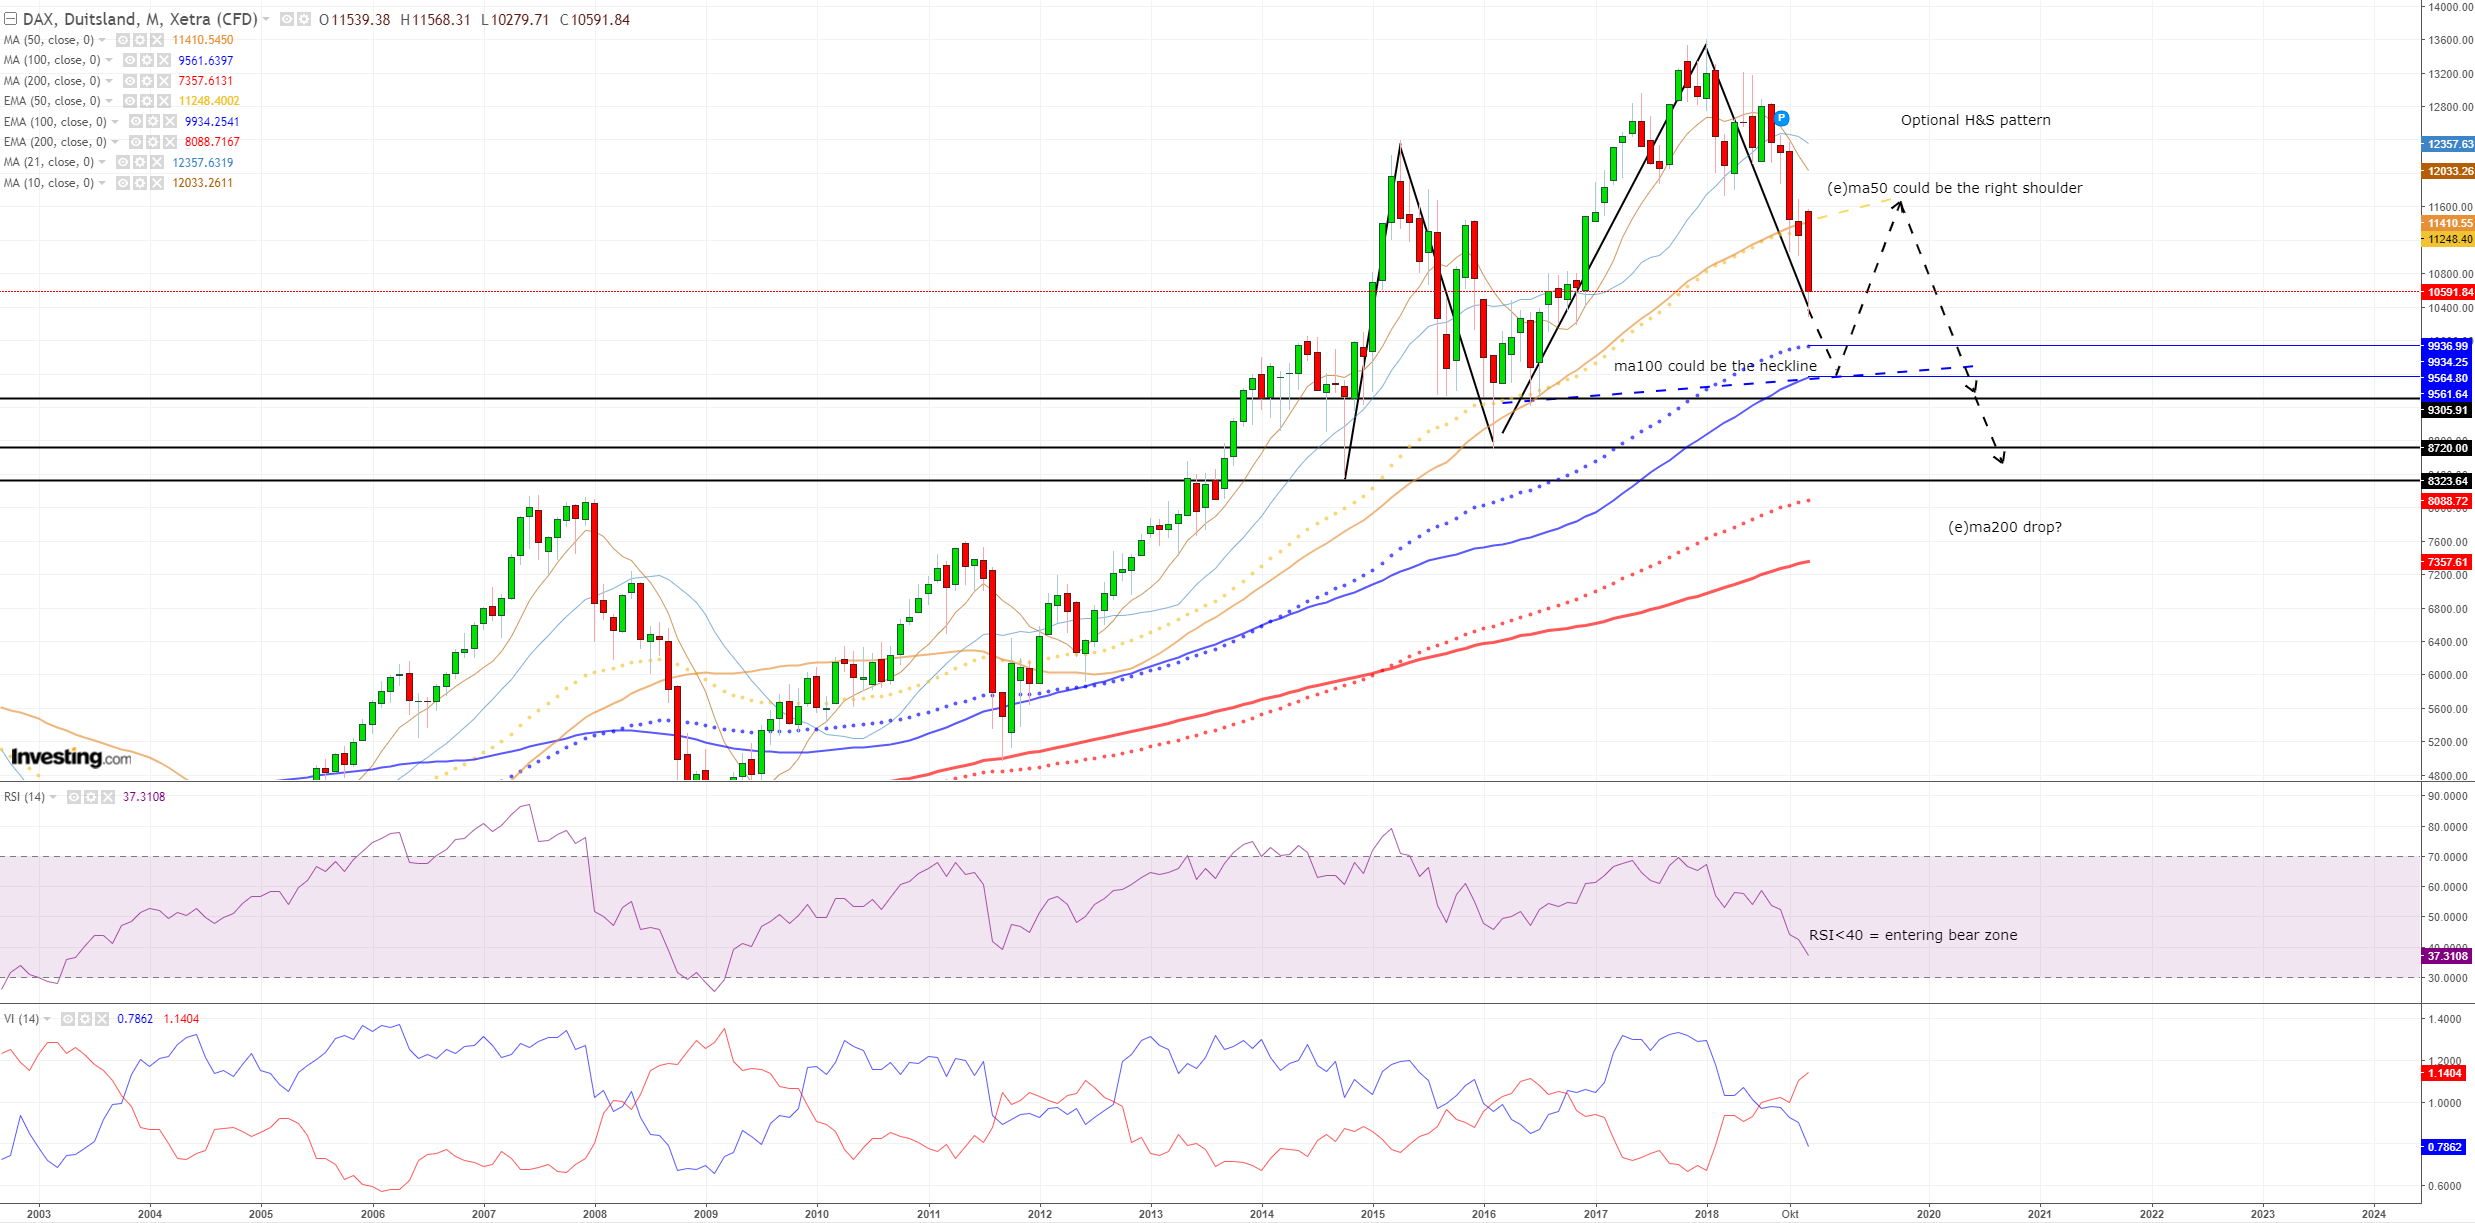
There is a lot to be seen on the Monthly chart. It's likely for the 100(e)ma (blue) to be a neckline of a potential H&S pattern. With the 50(e)ma to be it's right shoulder.
Of course a lot of things could happen this isn't a guarantee but a likely scenario, since we're inside a bear market and waiting for some correction, this correction could be turning out into a H&S pattern.
1 Week
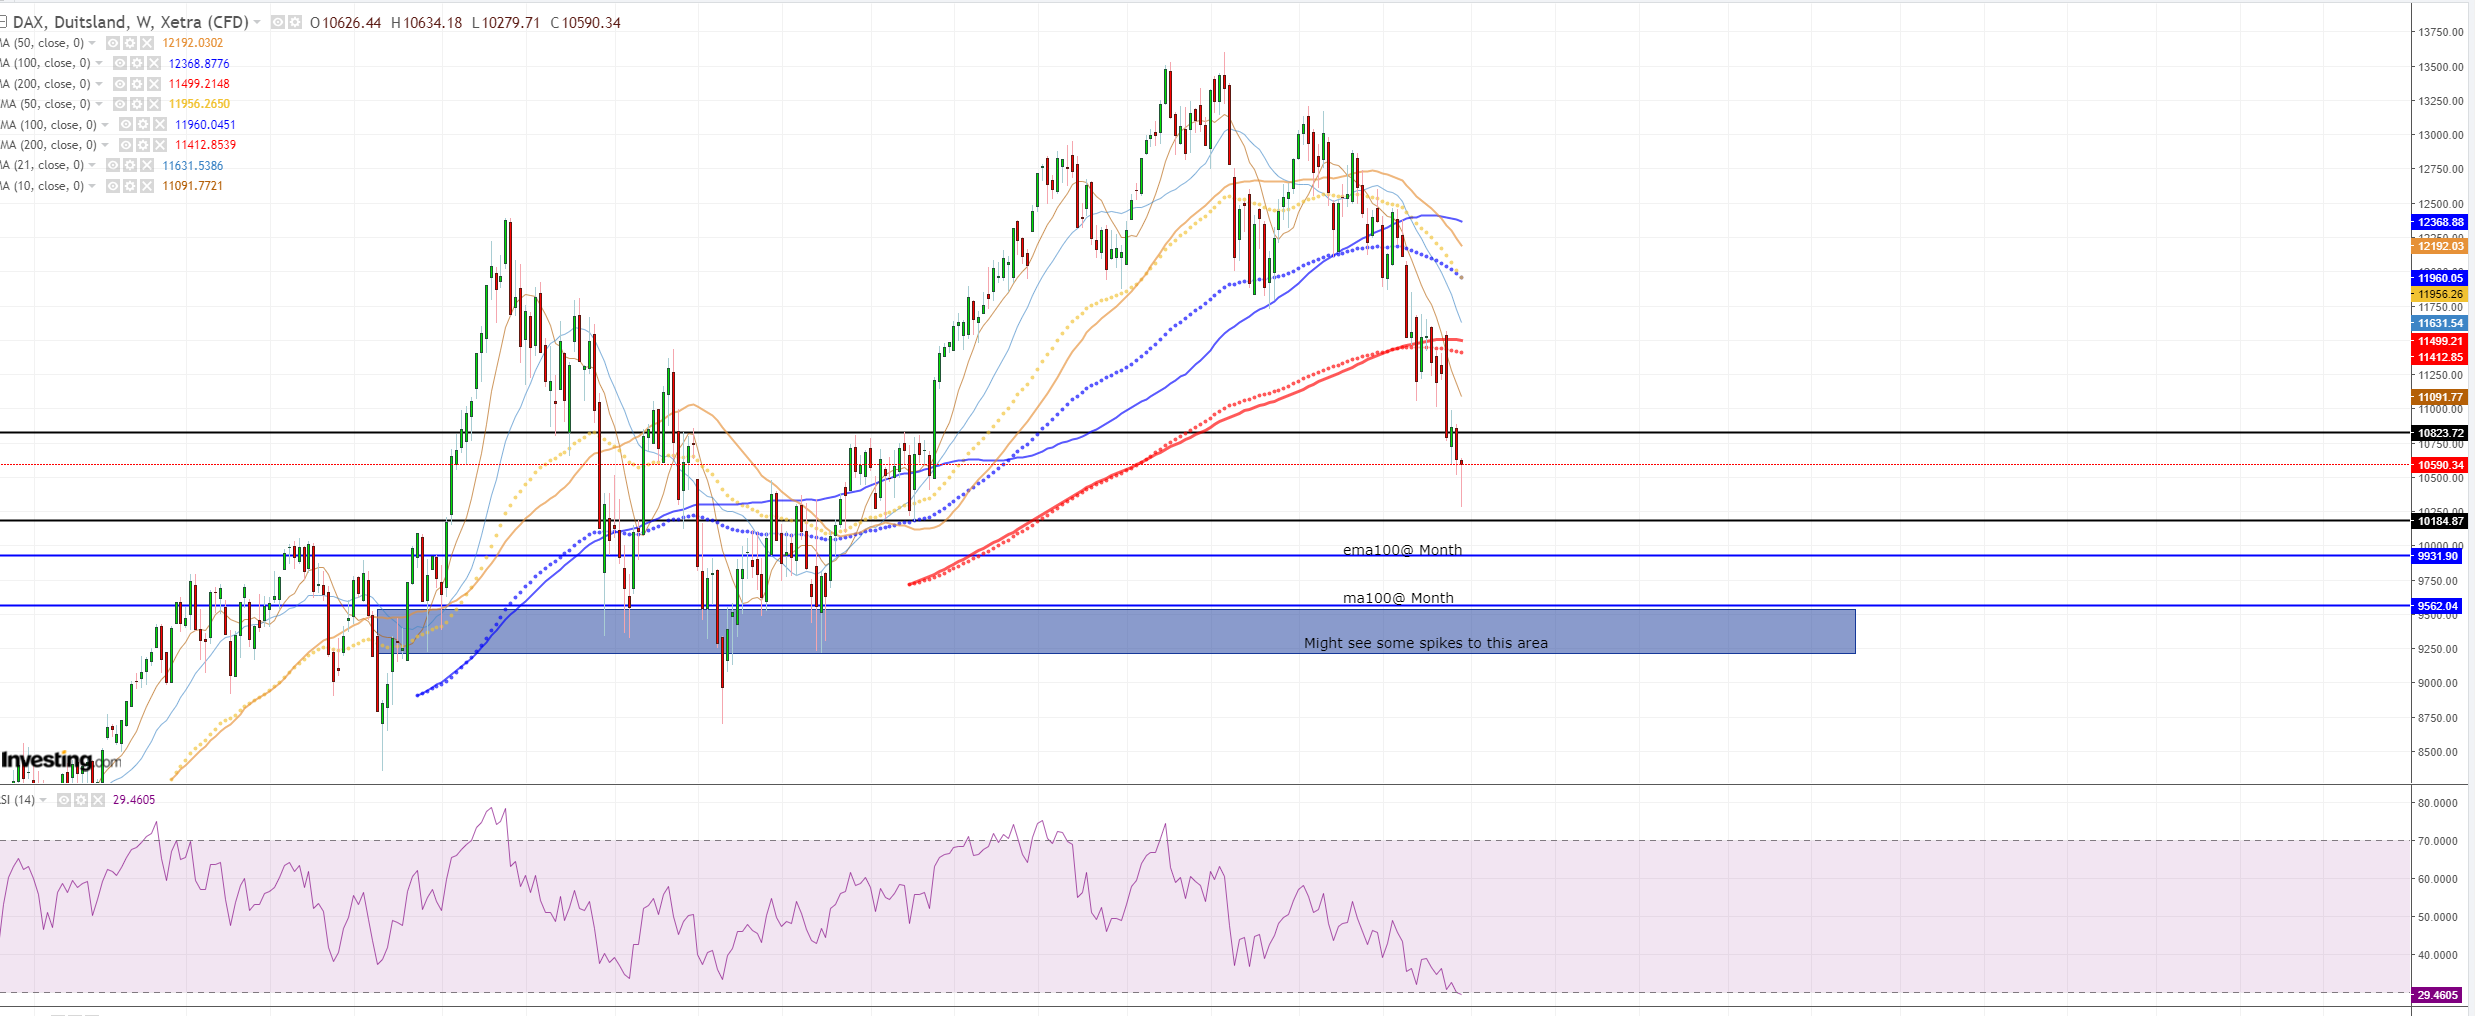
Week candle isn't finished yet, but for now it's a hammer. We might go up to 10.824 or even a bit higher ~11.000 because of ma10.
For longer periods I expect 10.184 because the area in the end of 2016 is showing some trouble over there. With a lot of ups and downs. So 10.185-10.825 is an important area. If we later fall through we might hit the Montly 100(e)ma. Which are around 9.560-9.930.
1 day chart
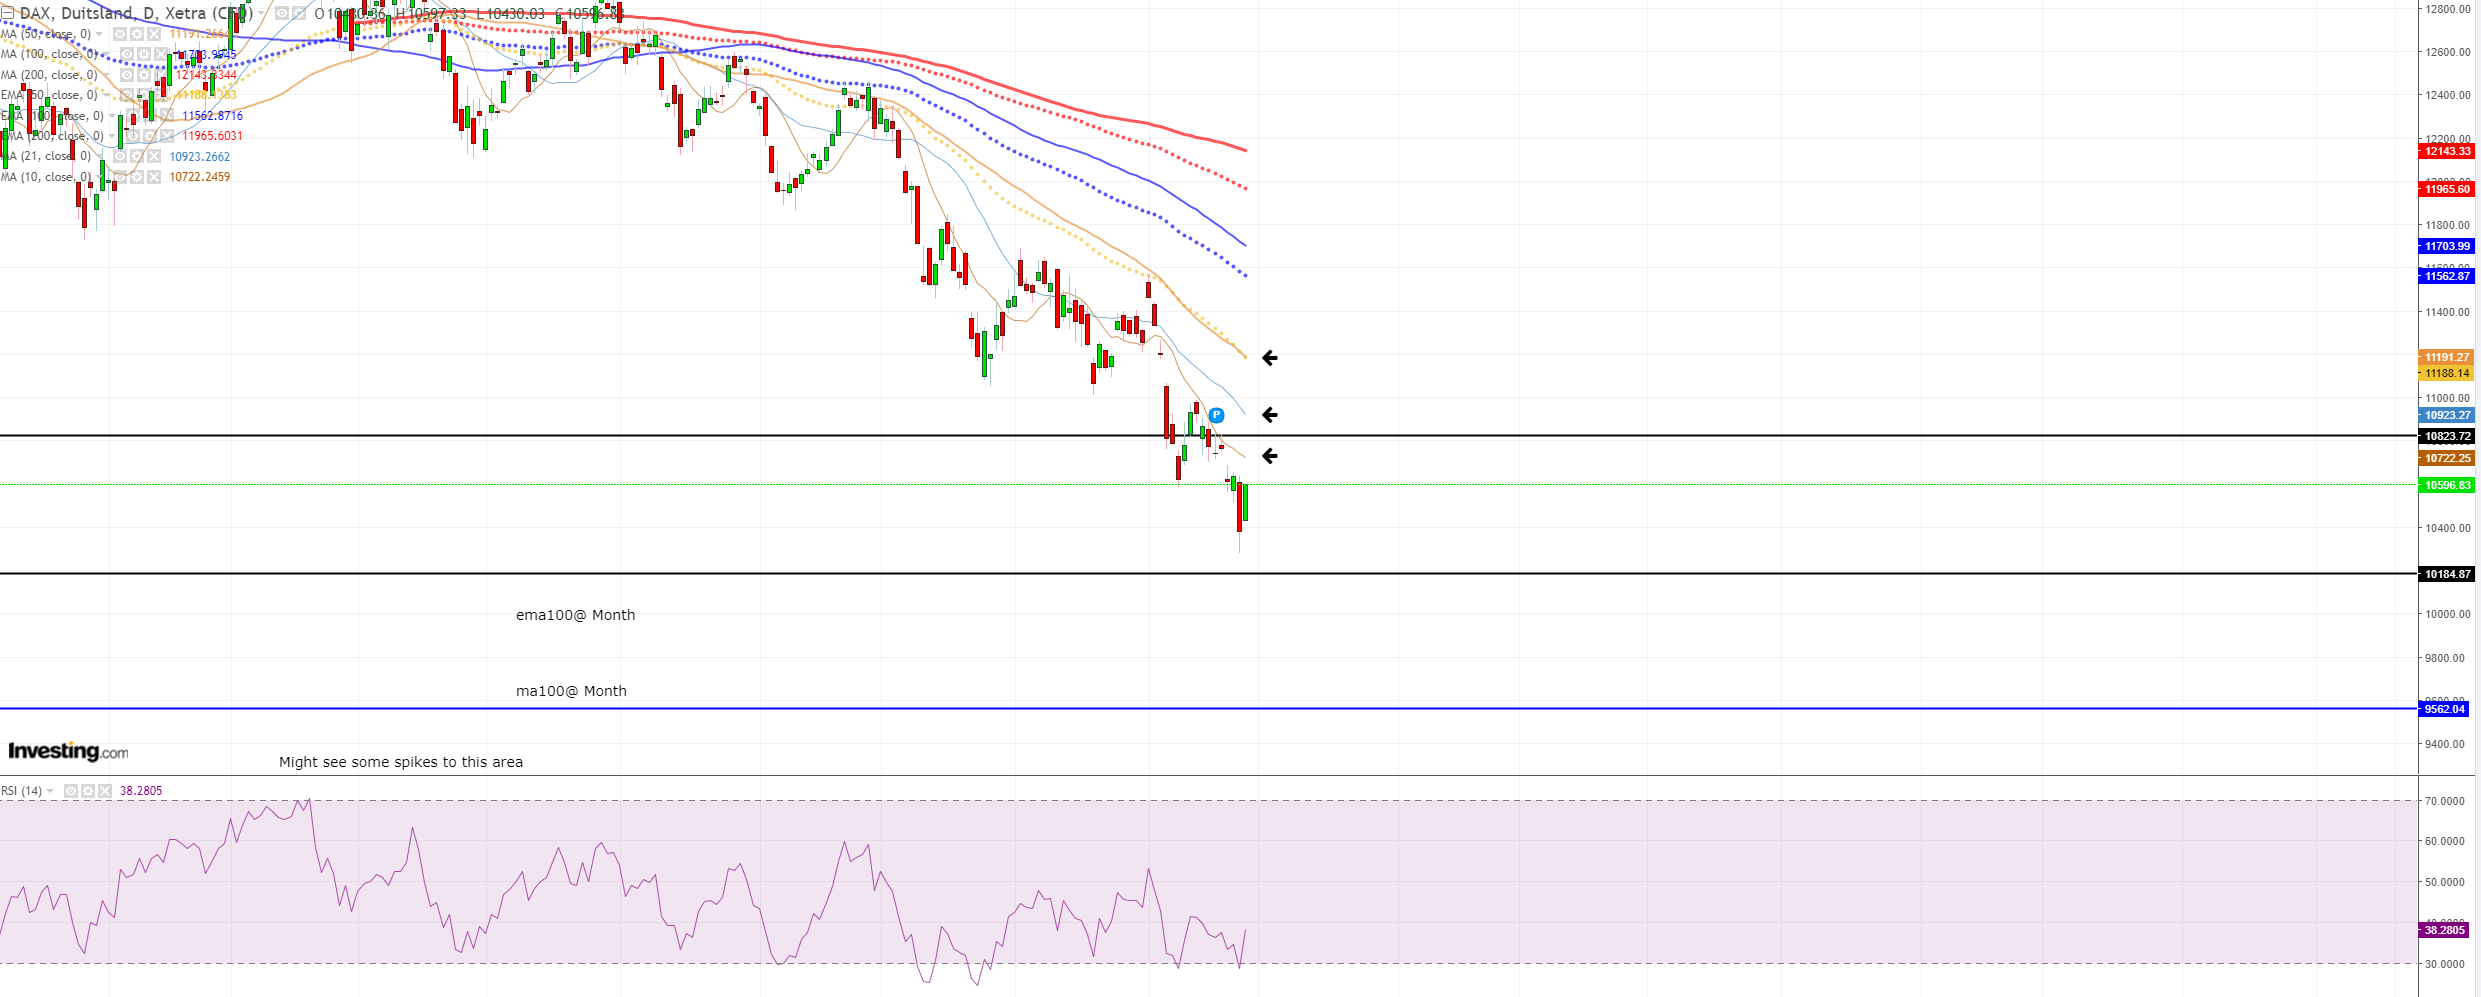
We are seeing a uptrend, we have to be carefull around the ma10 around ~10.720 the previous spoken 10.825 border and above the ma21, which will soon be around 10.825 So I think the market won't breack this 10.825 but a max up will be to the (e)ma50 (yellow) @ 11.190 But for me that looks a bit too high too fast, but could still be because of the ma10 on week . But then we break out of this area inside 10.185-10.825
1 hour
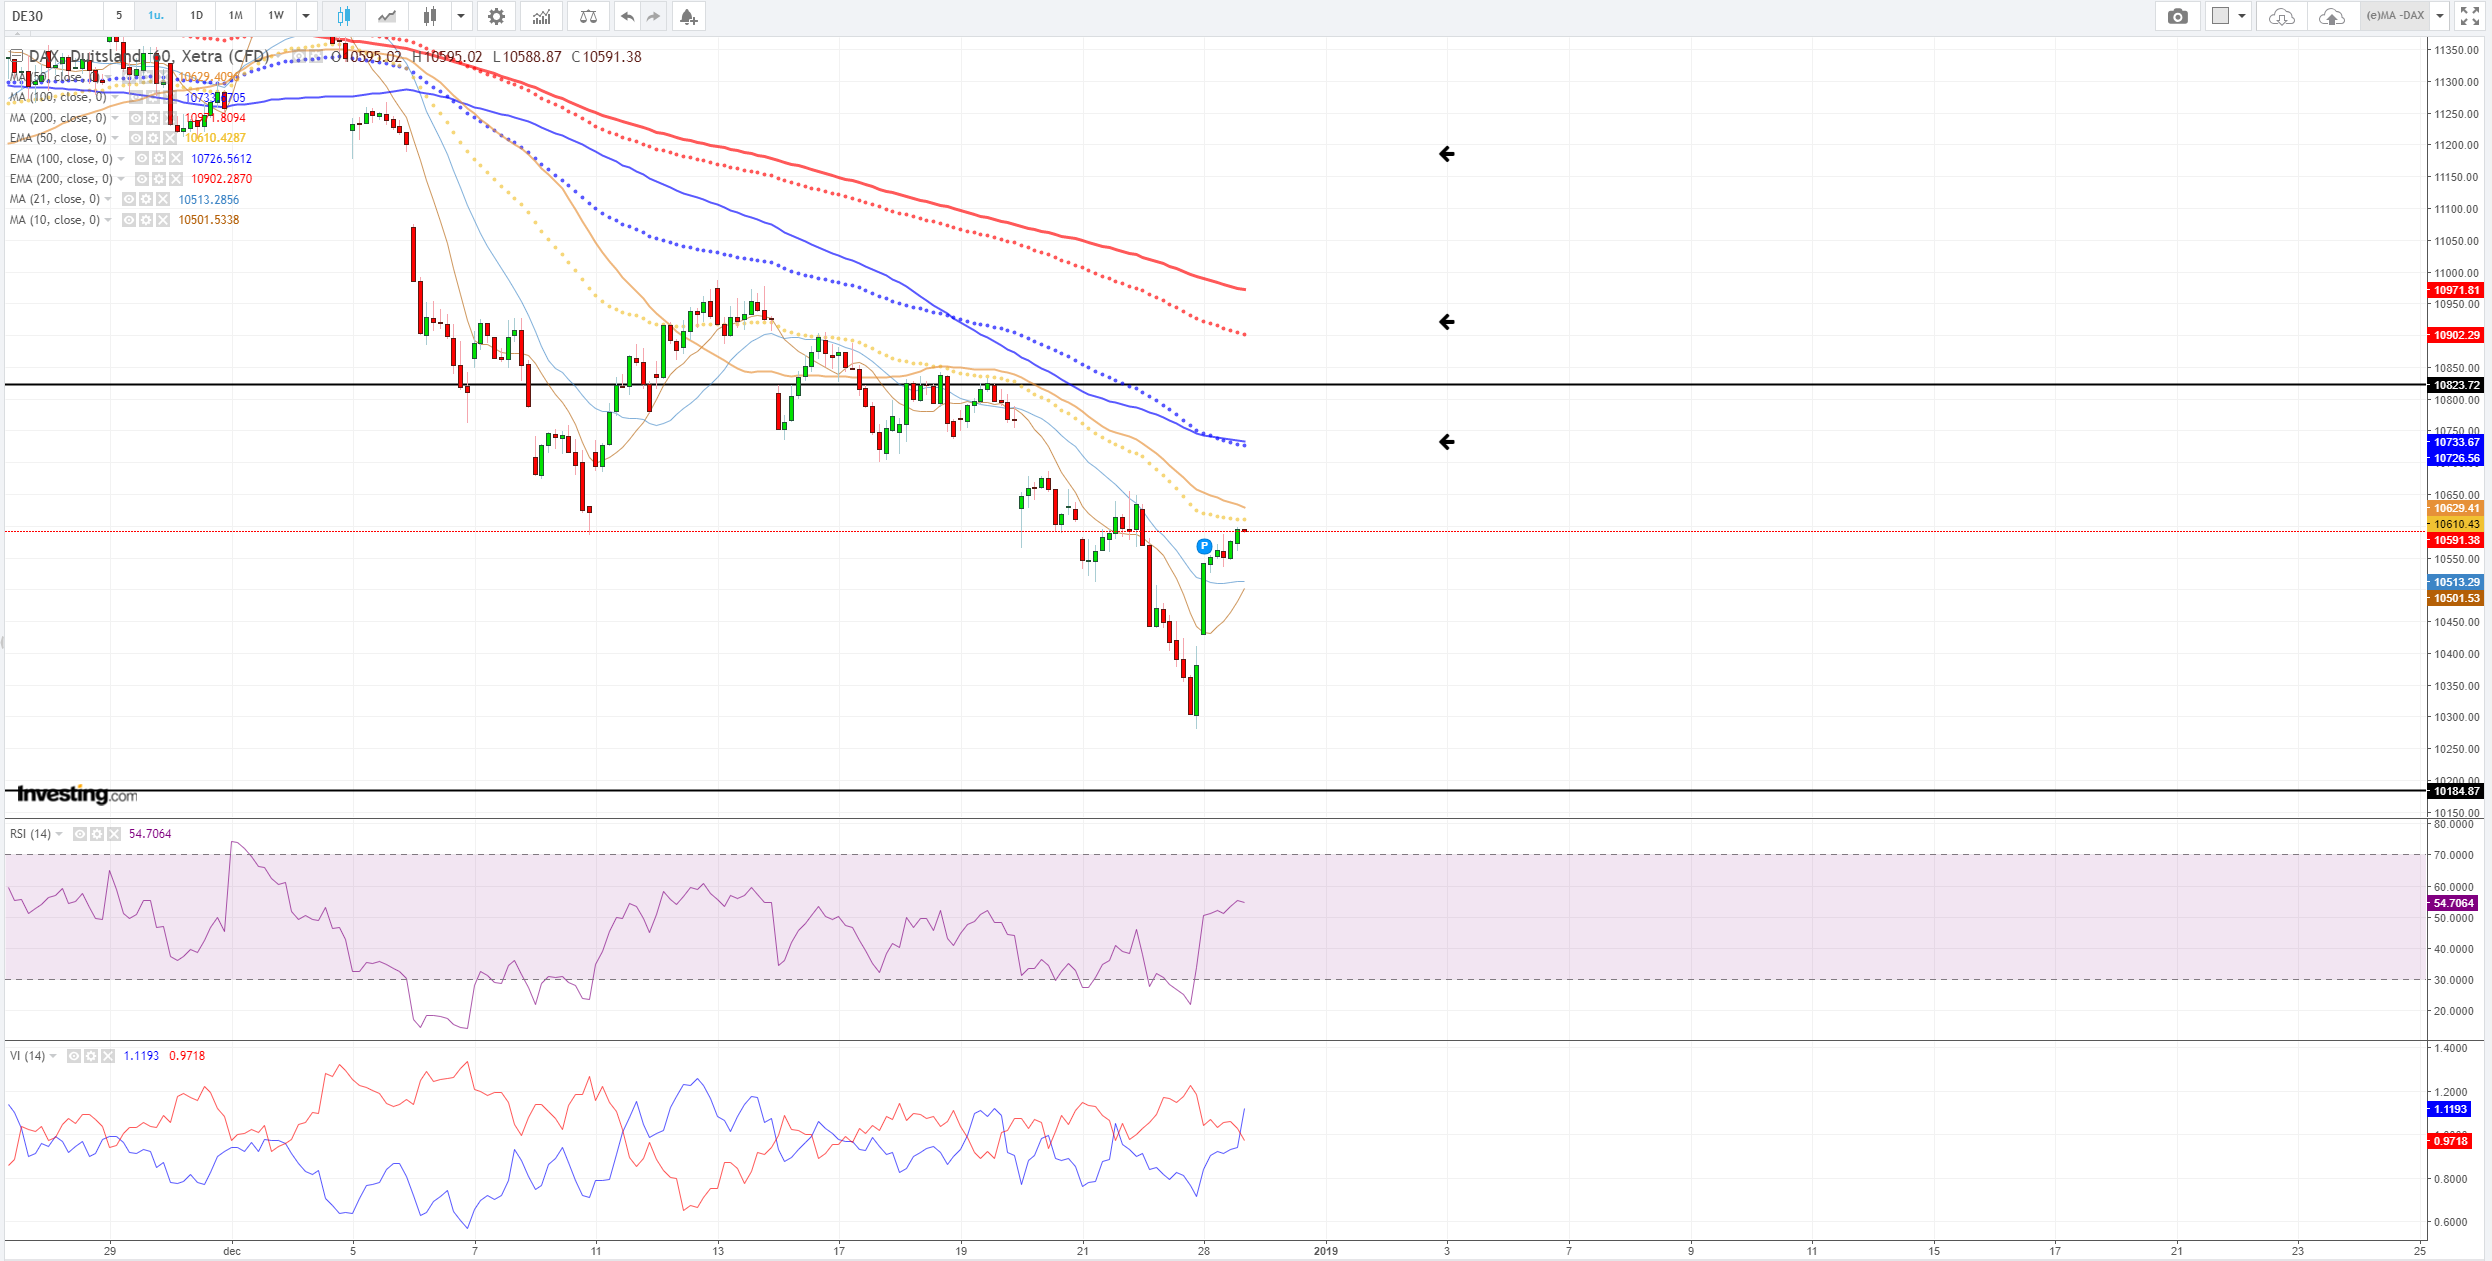
For now I think it's hard to breach the (e)ma50 (yellow). But signs of higher charts show us that the ma10 could be hit, which corresponds with the (e)ma100 (blue). The (e)ma200 (red) corresponds with ma20 on daily chart. But this would break out of the 10.185-10.825 area which I rate as a lower chance to break above, not 100% sure off course.
TA is no guarantee