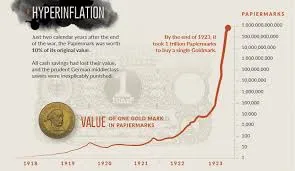
Somehow, I got a feeling that the amount of Steem being supplied is hyperinflationary, and am very curious/nervous about the amount of new steem entering circulations. However, I'm unable to find any reliable historic data so I aim to have this post as a guideline to the amount of steem being circulated.
I want steem to succeed as I'm sick of the likes of facebook etc... Decentralisation appears to me, and Mark Z does not need to get any richer. Especially with selective censorship decisions made by the power that be, is simply wrong.
Update 1: I'm now able to Power Up, thanks!
Update 2: I'm now trying to keep the below table updated!
Update 3: Made the below table easier to read, with hourly data as long as I'm awake!
I'll try to update the total number of Steem continouously in this post by keep editing this post I want to get a handle of its dilution rate, as it's definitely much faster than 0.19% per day published in the white paper, it's more like 1% per day. I'll use UTC time for consistent comparison. However, I'm not a script and I have to manually update the table once per hour. If the below table helps others then it's all worth it.
Sunday, 17 July 2016
| UTC Time | Total STEEM Supply | Daily % | Yearly % |
|---|---|---|---|
| 22:00 | 103239859.764 | ||
| 23:01 | 103288350.822 | 1.11% | 5717% |
| 00:00 | 103336393.33 | 1.14% | 6297% |
| Monday, 18 July 2016 | |||
| 01:00 | 103385061.983 | 1.14% | 6185% |
| 02:00 | 103433043.171 | 1.12% | 5824% |
| 03:00 | 103479497.66 | 1.08% | 5108% |
| 04:00 | 103527355.608 | 1.12% | 5742% |
| 05:00 | 103574748.47 | 1.10% | 5511% |
| 06:00 | 103621737.326 | 1.09% | 5316% |
| 07:00 | 103668818.744 | 1.10% | 5348% |
| 08:00 | 103717064.845 | 1.12% | 5890% |
| 09:00 | 103764041.961 | 1.09% | 5282% |
| 10:00 | 103811381.057 | 1.10% | 5436% |
| 11:00 | 103859898.813 | 1.13% | 5993% |
| 19:00 | 104237284.7 | 1.09% | 5307% |
| 20:00 | 104284694.355 | 1.10% | 5370% |
| 21:00 | 104331151.935 | 1.07% | 4948% |
| 22:00 | 104375492.66 | 1.03% | 4136% |