Many things follow a Normal distribution, the height of people, blood pressure, marks on a test. When plotted, normal distribution follows a bell-shaped curve.
Normal distribution has symmetry and both sides of the curve are the same size. 50% of the values are less than the mean and 50% are greater than then mean. With Normal distribution you will also find the mean = the median = the mode (if there is a mode)
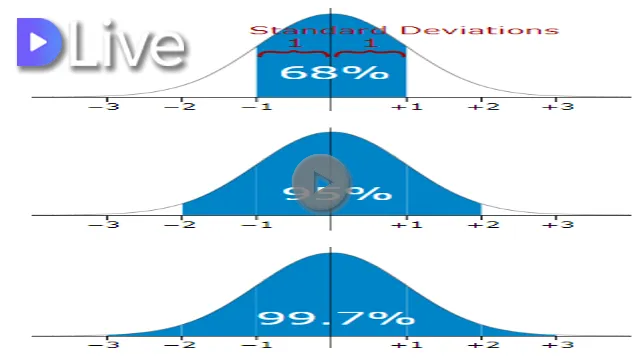
Standard deviation is a measure on how spread the number are. With Normal distribution you will find 68% of the values are within 1 standard deviation of the mean. 95 of the values are within 2 standard deviations f the mean and 99.7% of values are within 3 standard deviations of the mean.
To use the Normal Distribution functions in Excel you must have the mean and the standard deviation.
NORM.DIST will calculate probabilities that are in the areas to the left of the curve
Its syntax is =NORM.DIST(x, mean, standard deviation, cumulative)
Where x is the variable you wish to solve for.
NORM.INV will calculate the percentiles. It syntax is =NORM.INV(probability, mean, standard deviation)
Do you want to learn while you earn? Check out the first learn and you earn Excel course on the Steem blockchain. You can find out more here https://steemit.com/steempress/@theexcelclub/worldsfirstlearnandearnexcelonlinecourse-nogkgrtzfz
My video is at DLive