In part 1 I laid out the fundamental analysis arguments of why I'm not investing in EOS yet: rapid inflation with no product.
I wanted to go over some of the technical analysis to confirm what the fundamentals say.
Broken Support
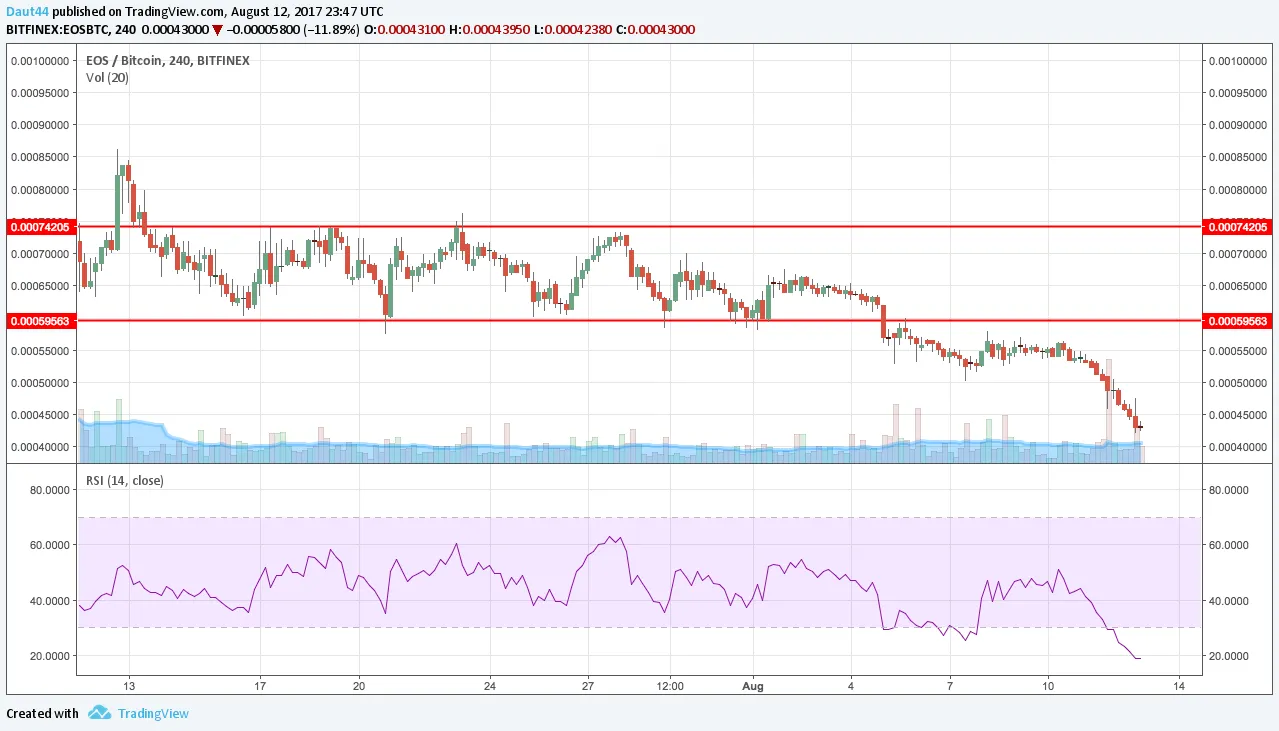
For roughly 3 weeks, EOS was trading between 59k and 74k satoshis. Ever since support for the 59k level was broken on August 5th, EOS has trended downwards at an ever increasing rate. There is no new support level so trying to figure out when the freefall stops is bottom guessing and could lead to disaster.
Exponential Moving Averages
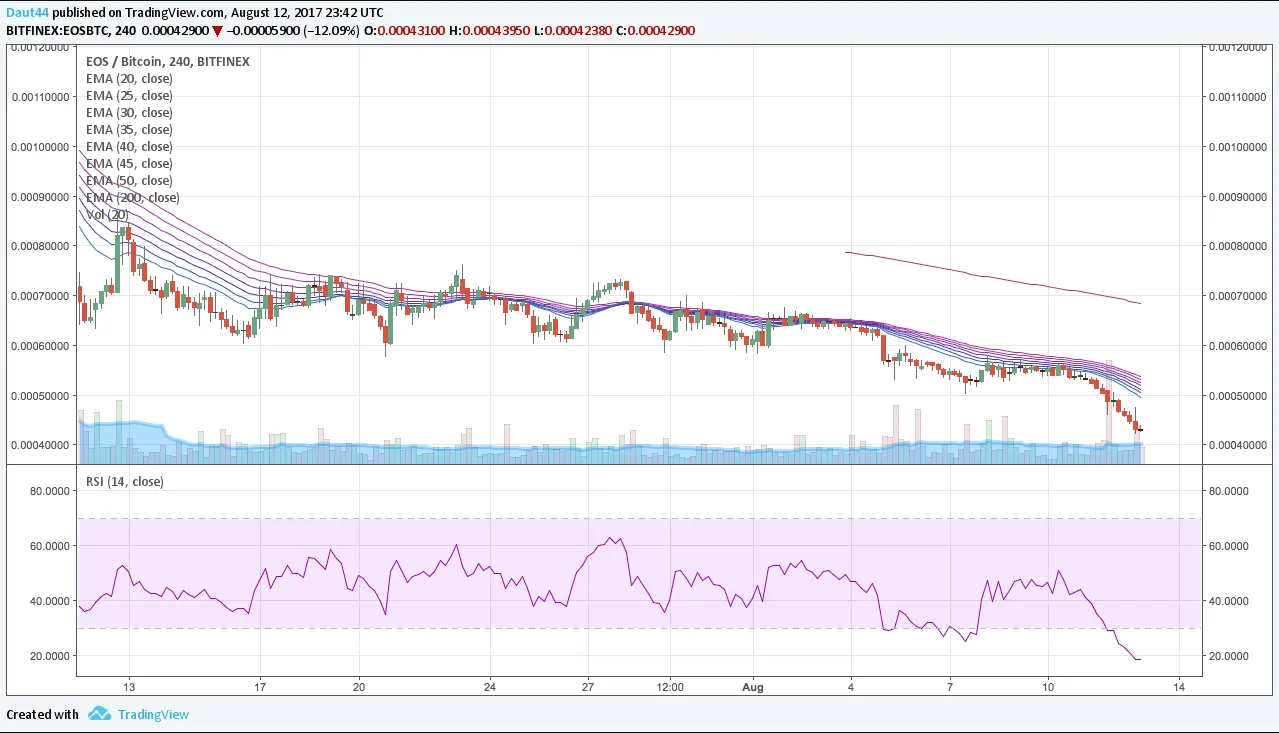
I like to use EMAs as one of my technical pillars: basically it's the average over the last X periods with higher weighting given to recent periods, so it follows price faster than a Simple Moving Average.
My general EMA tests:
- Never buy when price is below important EMAs
- Never buy when EMAs are sloping downwards
EOS fails both of these tests for every EMA I use between 20 and 200 periods on the 4 hour chart.
Ichimoku Cloud
You can read about Ichimoku Clouds here.
Basically it's an indicator that appears complex at first, but once understood, allows you to take in a lot of information about a chart quickly.
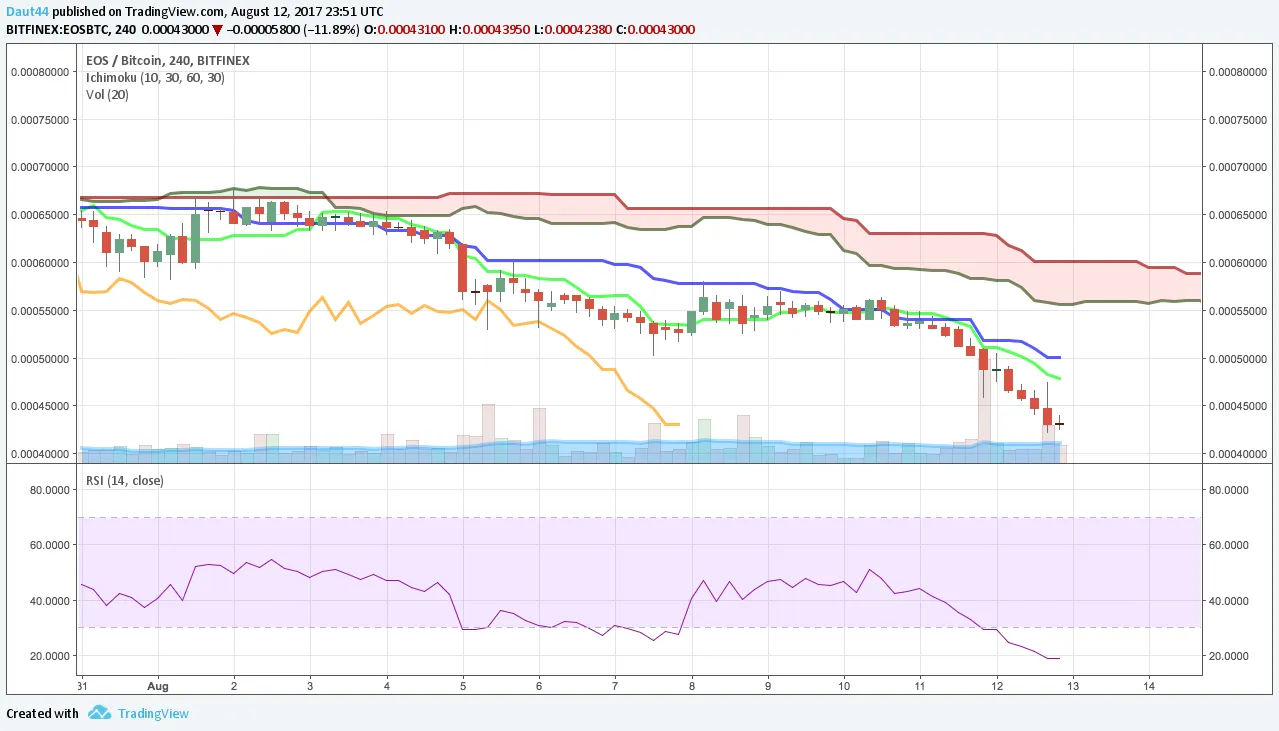
- The blue line is the average of the 30 period high and low.
- The lime green line is the average of the 10 period high and low.
- The yellow line is the price plotted 30 periods in the past.
- The red line on the cloud is the average of the previous 60 period high and low, plotted 30 periods in the future.
- The green line on the cloud is the average of blue line and the lime green line, plotted 30 periods in the future.
My basic Ichimoku cloud rules:
- Don't buy when the blue line is above the price.
- Don't buy when the yellow line is above the price.
- Don't buy when the price is below the cloud because the cloud acts as a resistance level
Once again, EOS fails all of my tests for this indicator.
One Possible Bullish Argument: Perhaps a Support Level at 42k Satoshis
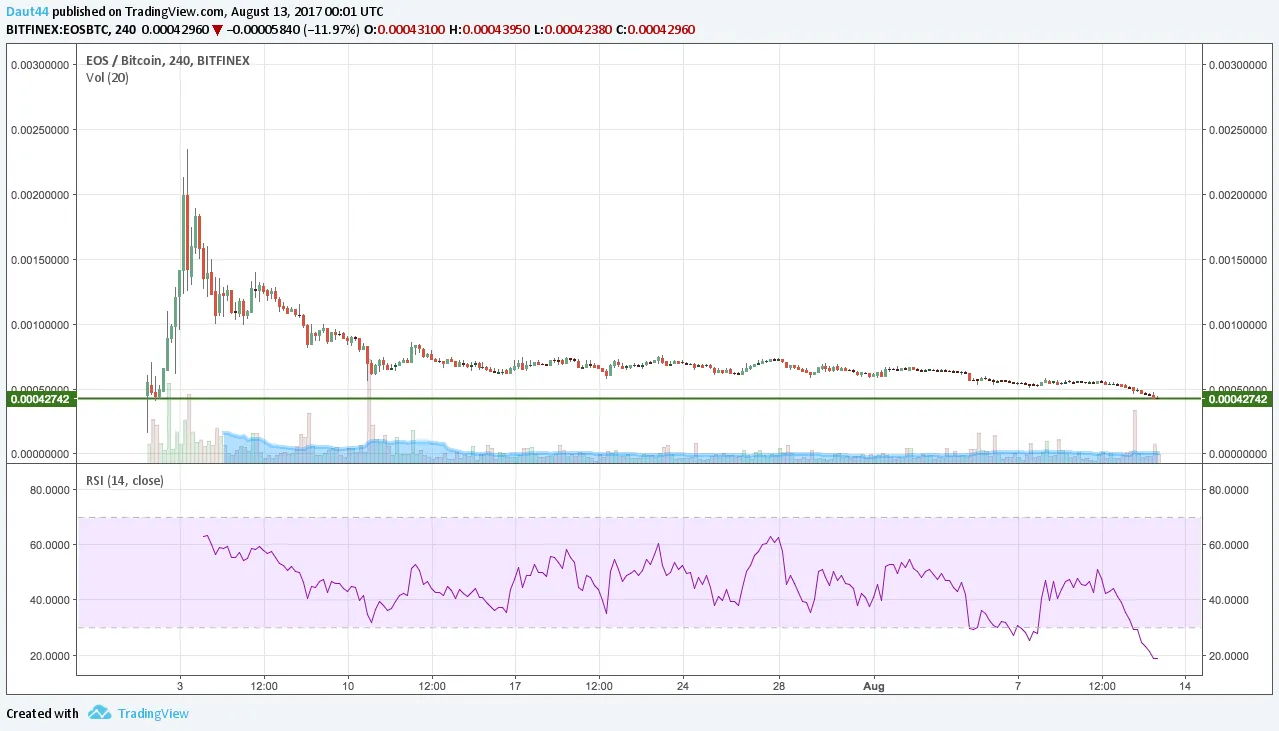
When EOS first appeared on exchanges, its price was roughly what it is now at 42k Satoshis. I think an untested support level from this long ago that appeared quickly into EOS's price history is more likely than not invalid, so I would ignore it. However, if you are a big believer in EOS and think it's possible this is a support and you want to buy, I would suggest putting in a stop loss at 39-40k Satoshis for a decent risk reward scenario (lose 5% worst case, possibly gain 30% to the resistance level). But I do not recommend this at all as I don't believe this support is valid.
Conclusions
Most of these indicators are somewhat correlated, but the essence is that buying now is trying to guess that you are buying low in hopes that the price goes up, but really you are just buying something that is trending downwards quickly and has no reliable support level to guess where the actual bottom is. It's possible the price keeps dropping with respect to BTC indefinitely.
If you want to be very aggressive and buy, make sure you have a quick stop loss, but I suggest waiting until the chart at least levels out and shows some bullish signs.
Remember: what you do with your money is your decision alone.
This is what I'm doing with mine, but it is just my opinion.
My name is Ryan Daut and I'd love to have you as a follower. Click here to go to my page, then click  in the upper right corner if you would like to see my blogs and articles regularly.

I am a professional gambler, and my interests include poker, fantasy sports, football, basketball, MMA, health and fitness, rock climbing, mathematics, astrophysics, cryptocurrency, and computer gaming.