
SUMMARY
IF one is long term greedy and contrarian; he or she often answers the question I pose: Should now be the time to be taking SELLING or BUYING actions?
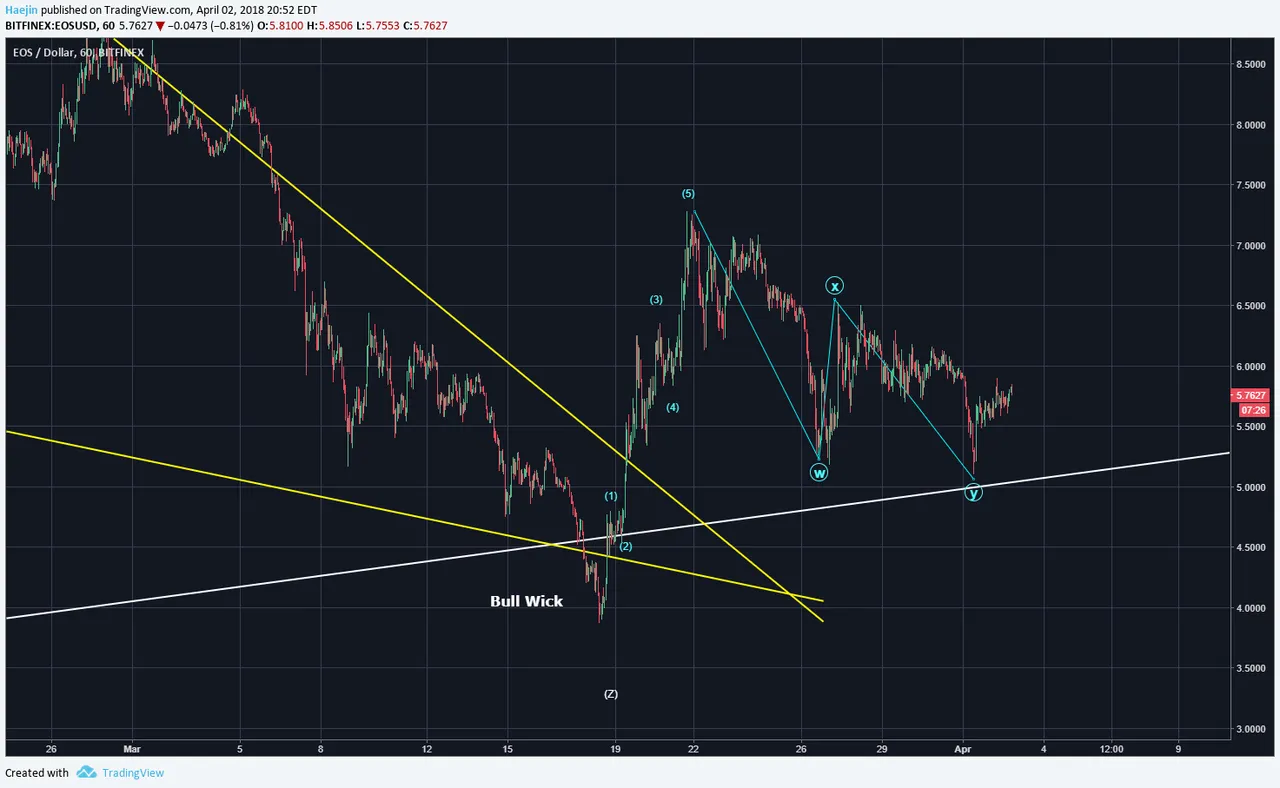
The below chart shows EOS price sitting on the bottom trend line support of a very large broadening pattern. What is it called when price is sitting on the lower trend line? Jaws of WEALTH! The potential profit could be MASSIVE as it had been when I had recommended EOS at sub $1! The MACD is almost ready to probably jump upwards! It's traversing in that symmetrical triangle pattern showing that the sellers are all on one side and keeling the boat! When this occurs, it's quite bullish!


The microwaves show that EOS could have put in the initial set of impulse and is correcting now in either a WXY or perhaps a more complex pattern. A second round of impulse is required to get a trend reversal confirmation.
Legal Disclaimer: I am not a financial advisor nor is any content in this article presented as financial advice. The information provided in this blog post and any other posts that I make and any accompanying material is for informational purposes only. It should not be considered financial or investment advice of any kind. One should consult with a financial or investment professional to determine what may be best for your individual needs. Plain English: This is only my opinion, make of it what you wish. What does this mean? It means it's not advice nor recommendation to either buy or sell anything! It's only meant for use as informative or entertainment purposes.
Please consider reviewing these Tutorials on:
Elliott Wave Counting Tutorial #1
Elliott Wave Counting Tutorial #2
Elliott Wave Counting Tutorial #3
Laddering and Buy/Sell Setups.
Laddering Example with EOS
Tutorial on the use of Fibonacci & Elliott Waves
@haejin's Trading Nuggets
Essay: Is Technical Analysis a Quantum Event?
Follow me on Twitter for Real Time Alerts!!
Follow me on StockTwits for UpDates!!
--
--

