Today I released steamcharts.io, a simple tool to visualize data for any steemit author or category. I've had some fun messing around with it, and wanted to share some of the interesting charts I found.
1. Being Dan Must Be Nice
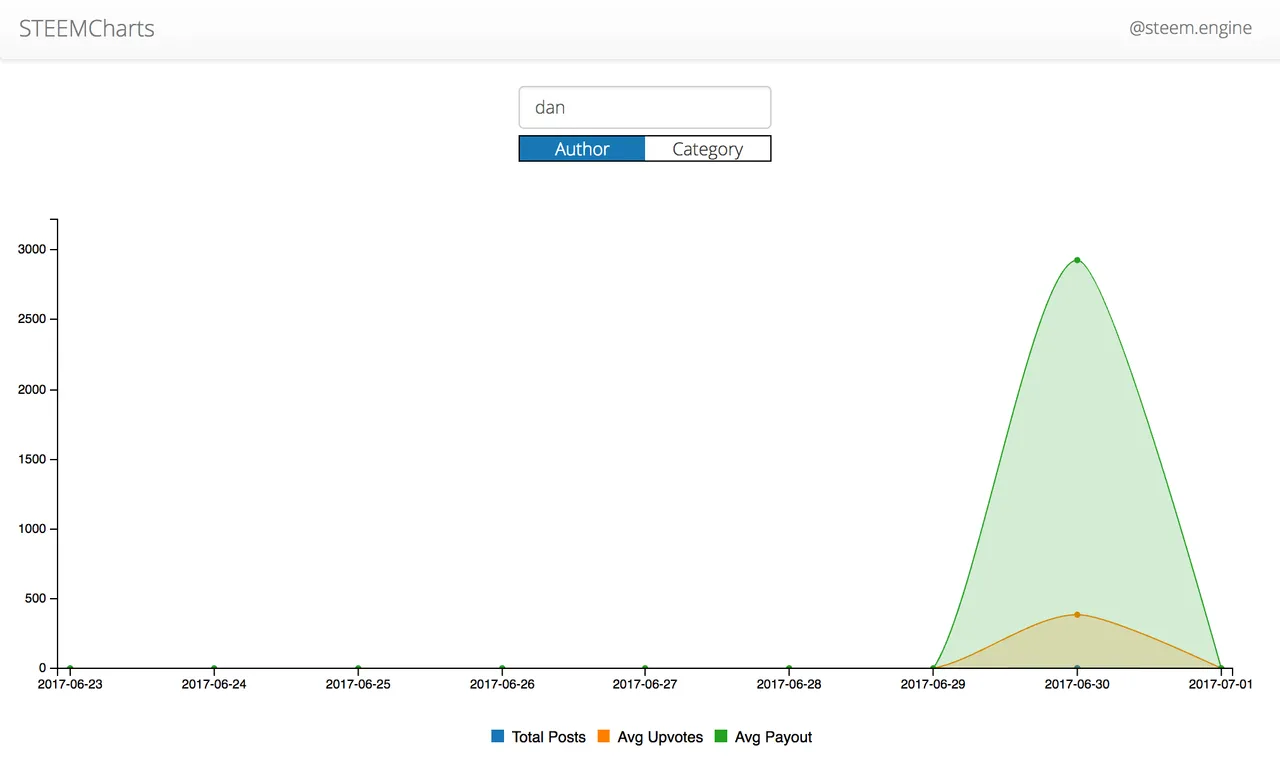
@dan has made one post in the last week, and earned almost $3,000. He's earned every penny. But damn. (update: He is declining payout, so it all goes back into the Steemit community. Pretty awesome)
2. The 'CN' Category Has Ridiculously High Payouts

I pointed this out in a previous post, but it's nice to be able to put a visual to it. 'CN' is the tag for Chinese posts on Steemit. Over the past week, they've been averaging about $80 per post. That's insane. For reference, the category 'Steemit' has had an average payout around $7. Here is the chart for the 'Steemit' category ...
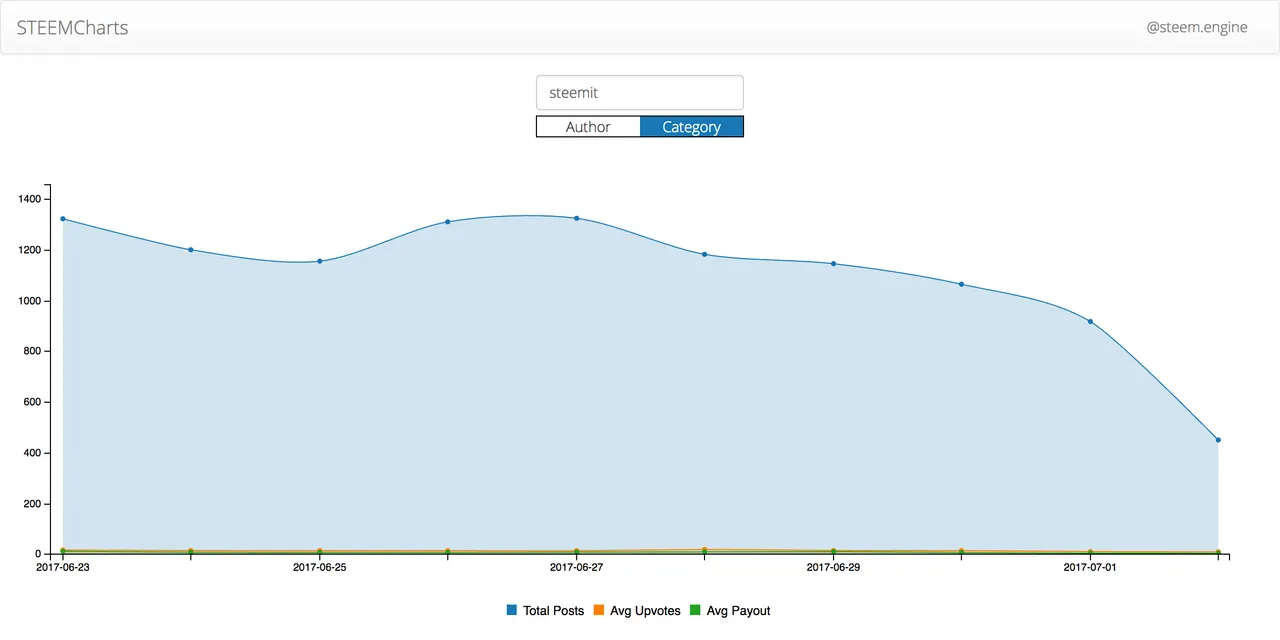
Blue is total posts, orange is avg upvotes, and green is avg payout. You can barely see the green.
3. EOS Is All Over The Place

Other than one spike, the posts per day has been pretty consistent. The payout and upvotes have been all over the place, however. This is likely due to a few very high powered users, who are legitimately involved in EOS, occasionally dropping EOS updates. These have been getting incredibly high payouts.
Ok, that's all for today! If you enjoy messing around with it, please give an upvote, resteem, and follow. Thanks for reading!