
SUMMARY
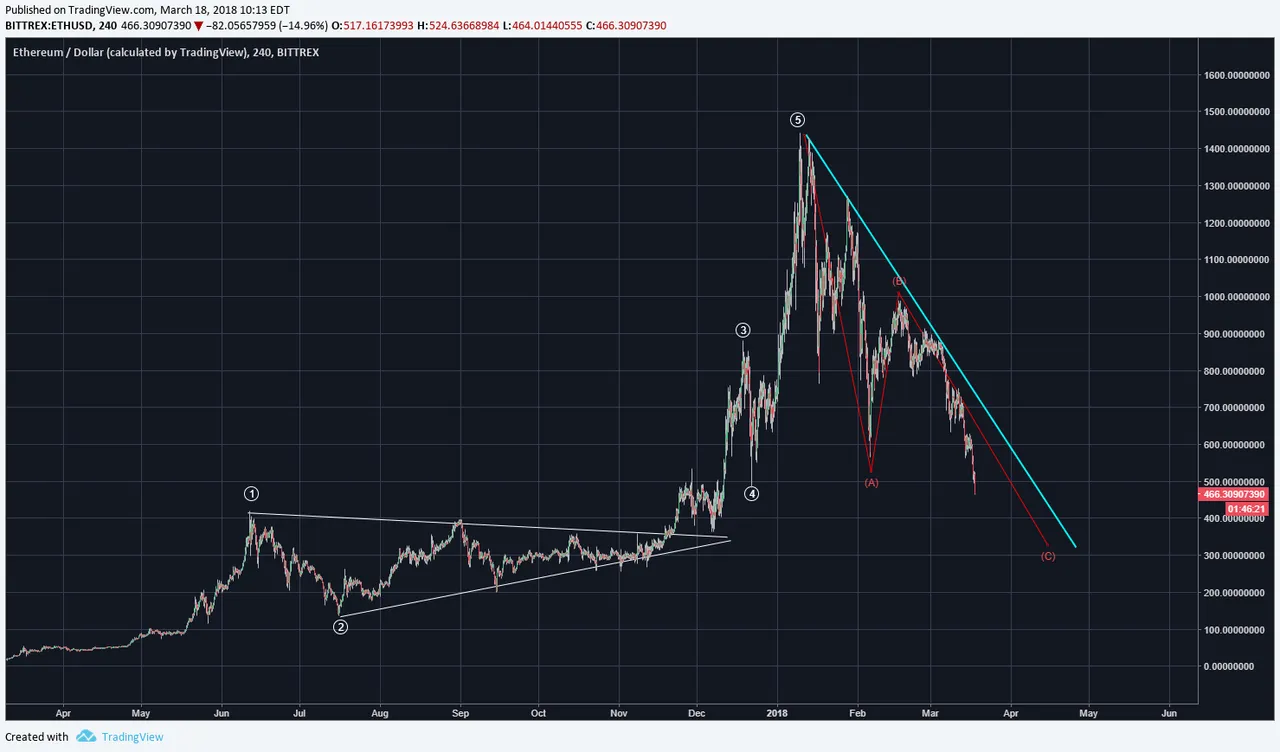
Ethereum (ETH) is being held down by a blue trendline resistance that has not yet been breached. However, I believe it's only a matter of first completing the correction which is likely to be a Flat (3,3,5) correction as shown by the ABC waves. It would seem that red C wave would have an affinity for the 0.78 Fibonacci zone.
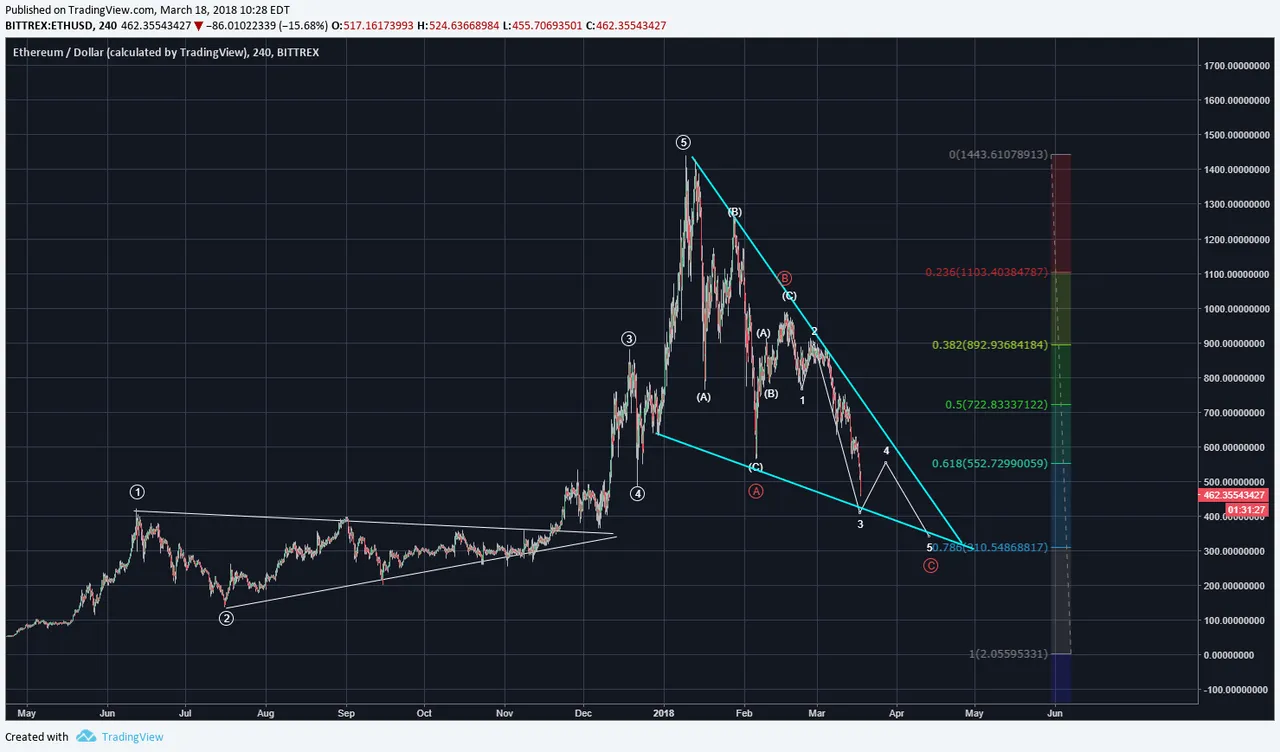
A detailed view shows that subwaes of red A as being three wave and the same for red B. Waves C and A would likely tend toward equality and that would likely mean the C would target the 0.78 Fibonacci level which is at $310 or so. Unlike LTC and BTC, ETH is not yet able to be counted as having wave 1 and 2 of a reversal because it has not yet completed the whole correction.
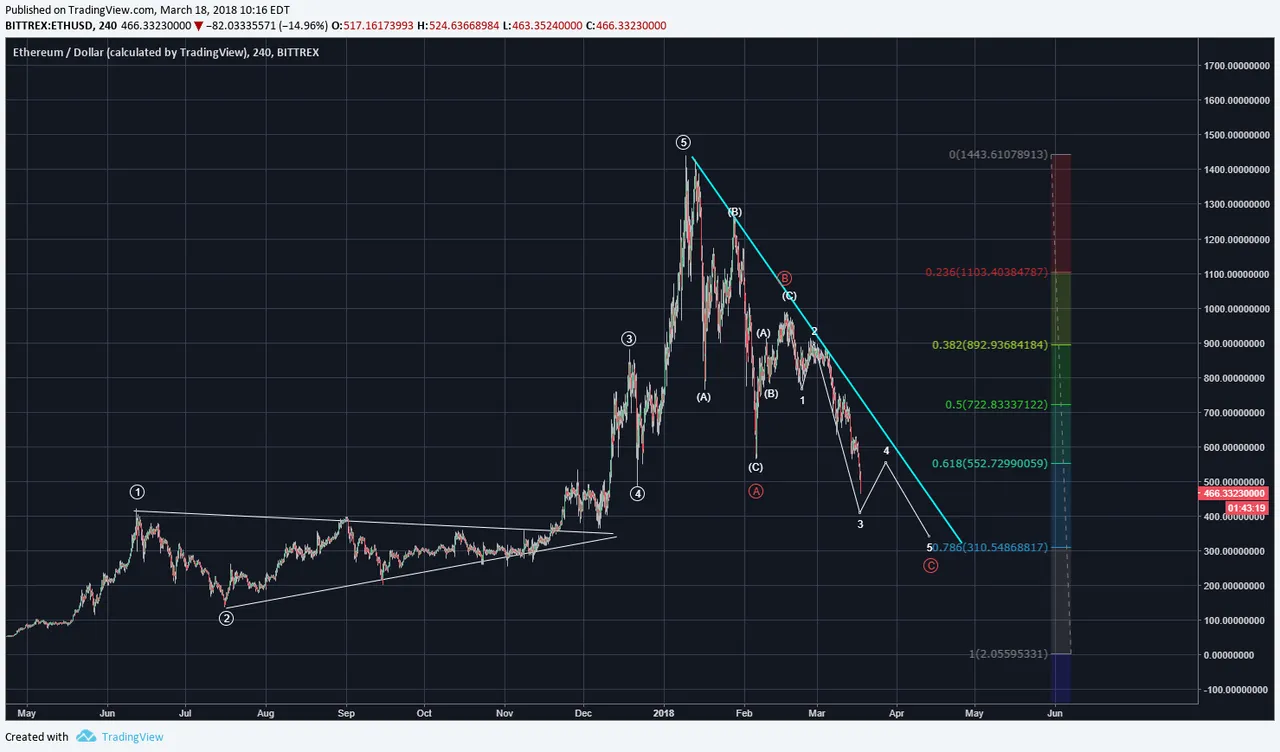
If a line is drawn across the current and projected price bottoms, a downward symmetrical triangle can be outlined. The confluence of pattern and waves are not accidents.
Legal Disclaimer: I am not a financial advisor nor is any content in this article presented as financial advice. The information provided in this blog post and any other posts that I make and any accompanying material is for informational purposes only. It should not be considered financial or investment advice of any kind. One should consult with a financial or investment professional to determine what may be best for your individual needs. Plain English: This is only my opinion, make of it what you wish. What does this mean? It means it's not advice nor recommendation to either buy or sell anything! It's only meant for use as informative or entertainment purposes.
Please consider reviewing these Tutorials on:
Elliott Wave Counting Tutorial #1
Elliott Wave Counting Tutorial #2
Elliott Wave Counting Tutorial #3
Laddering and Buy/Sell Setups.
Laddering Example with EOS
Tutorial on the use of Fibonacci & Elliott Waves
@haejin's Trading Nuggets
Essay: Is Technical Analysis a Quantum Event?
Follow me on Twitter for Real Time Alerts!!
Follow me on StockTwits for UpDates!!
--
--

