Ethereum (ETHUSD) has broken out of the triangle pattern in the four-hour chart.
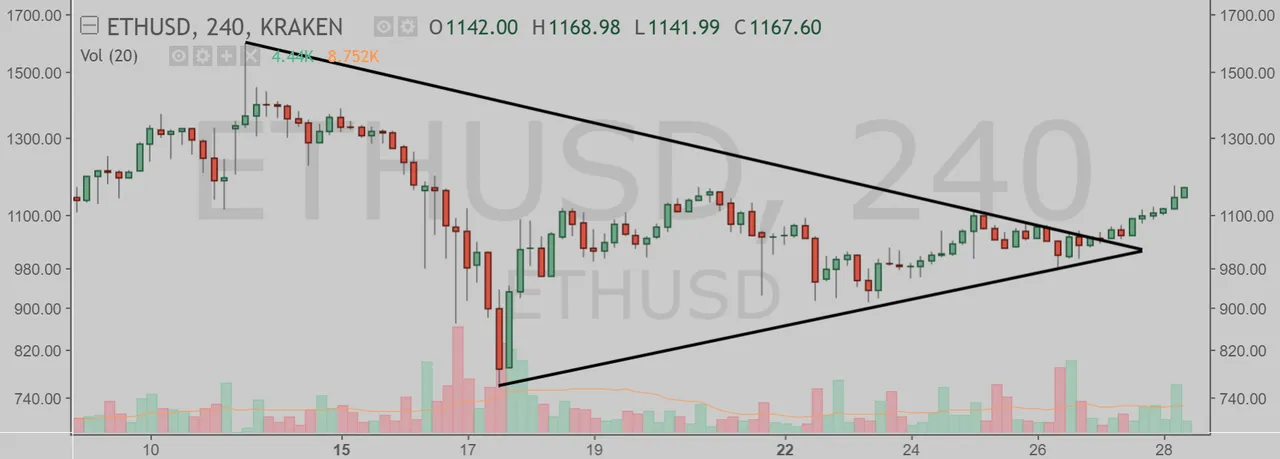
(Chart courtesy of Tradingview.com (log scale))
Elliott Wave Analysis
In Elliott Wave terms, Ether began a wave one advance on September 15, 2017. The red wave one finished on October 16, 2017, and the red wave two correction ended on October 23, 2017. The red wave three (blue sub-waves i-ii-iii-iv-v) advance finished on January 13 this year, and the red wave four correction ended on January 17. If this wave count is correct, Ether should be heading next towards the January 13 peak in the red wave five.
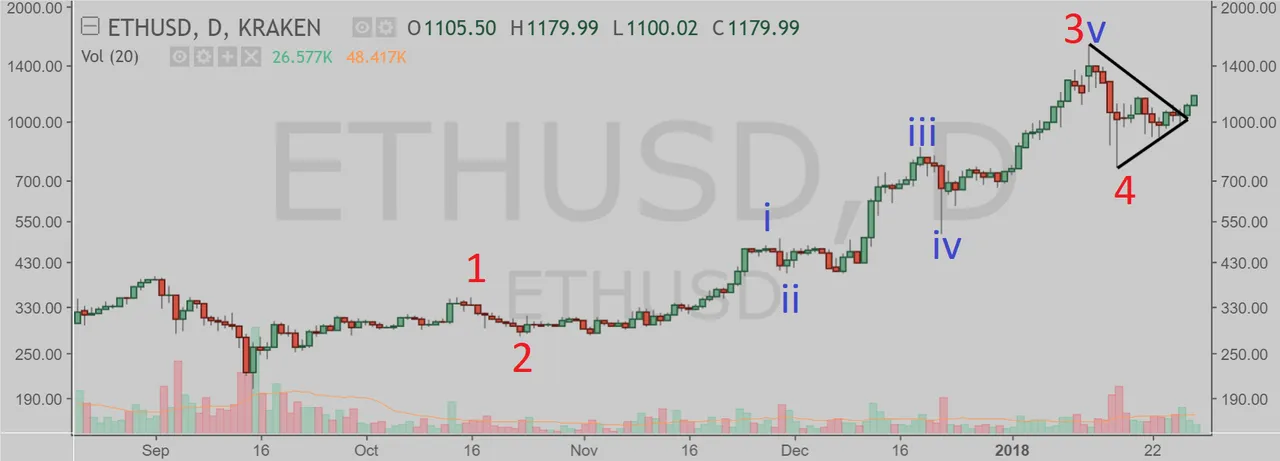
(Chart courtesy of Tradingview.com (log scale))
Looking at the weekly chart, I believe Ether is currently in the red wave five (blue sub-wave iii). The blue sub-wave three began on September 15, 2017.
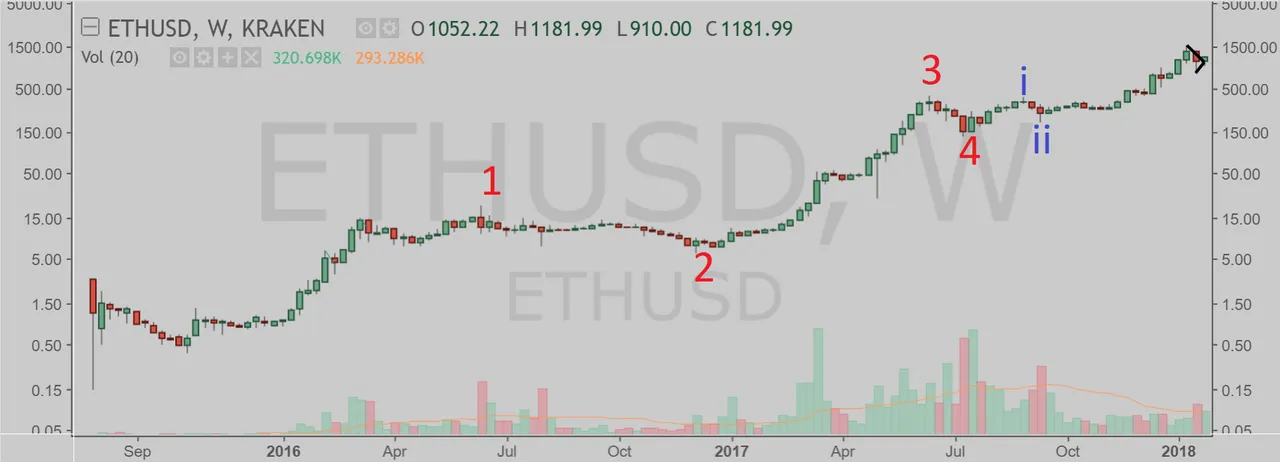
(Chart courtesy of Tradingview.com (log scale))
Funnymentals
Here is an "old" video where Vitalik Buterin explains Ethereum.

(Sources: https://www.ethereum.org/ and YouTube)

If you think this analysis is correct, upvote this post (min $0.01) and upvote the comment (min $0.01) "Ether will takeout the January 13 peak".
If you think this analysis is wrong, upvote this post (min $0.01) and upvote the comment (min $0.01) "Ether will drop below the January 17 low".
If you think Ether is in a range, upvote this post (min $0.01) and upvote the comment (min $0.01) "Ether will stay in a trading range between the January 17 low and the January 13 peak until February 28".
You can upvote the comment until 3 PM EST January 29 and you can upvote only one comment. 50% of SBD from this post will be distributed equally to the winners. The winners will be determined by the price action (which one happens first).
Bonus
I will be sending one Trophy Token to everyone who manages to get these crypto contests right seven times in a row. If/when you accomplish this, please contact me at Steemit Chat with your BitShares address.