So, how do you do a three point projection in log? When I measure the leading diagonal that topped in 2016, and move the tool to the 1-2, the 2.0 is in the wrong spot. It appears to be linear. BTC should have topped just above the 2.0 but it's at the 4.236. Appears to be linear to me. 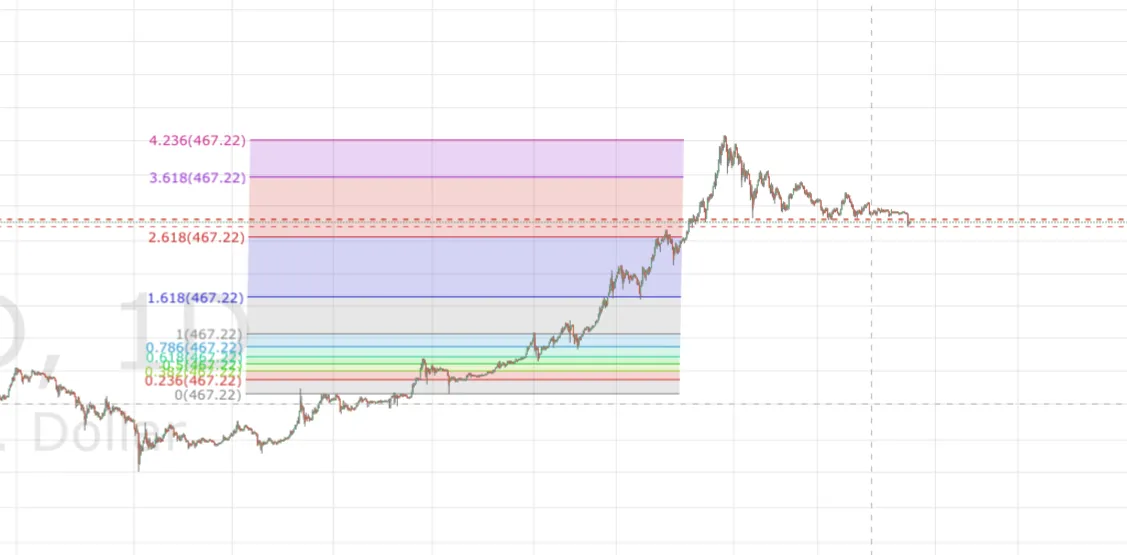
RE: Chart of the Day: Ethereum coming in for a landing?