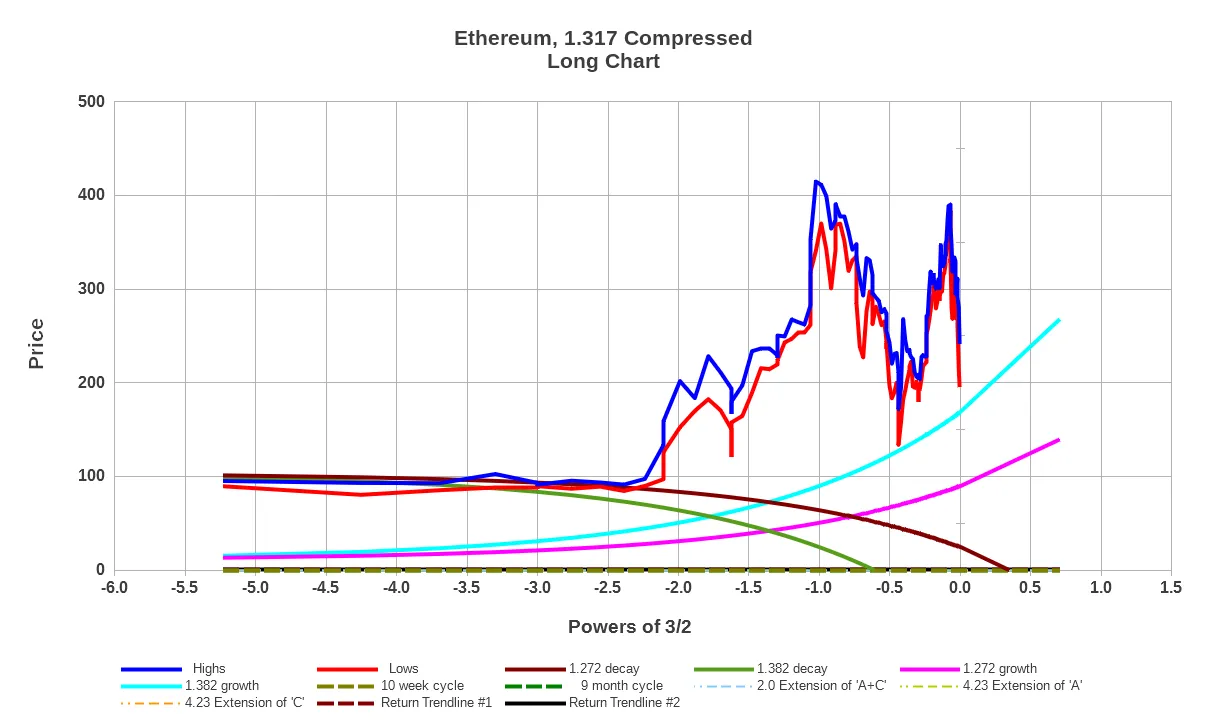
First chart is plotted with Logarithmic time scales and shows the magenta trendline relentlessly forcing price action lower. This won't be considered reversed until the highs of each day climb above that same magenta trendline.
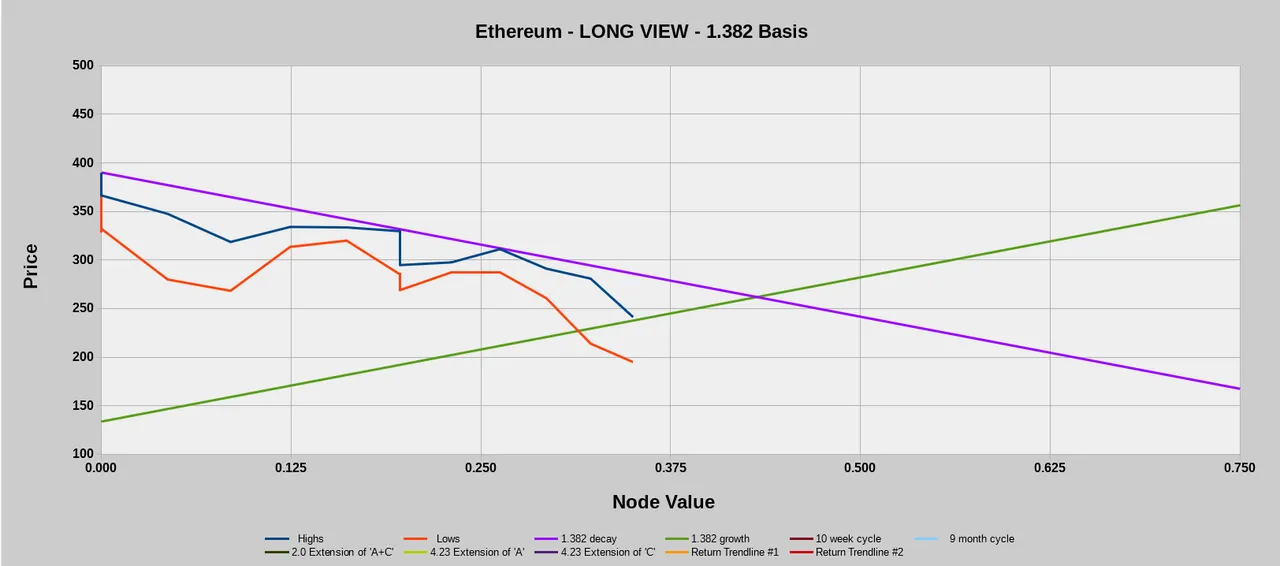
The second chart shows how close this mornings bottom got us to a longer term trendline, down around $169. This is still the potential target if the rally this morning should ultimately fail.