One of the most legendary features of Microsoft Excel is the PivotTable. The pivot table is by far one of the most useful ways to analyze and visualize your data in Excel. If you have never used a pivot table or seen what it is capable of, we will be taking a fast track look in this article.
With the use of pivot tables, you can visualize your data different ways. For those of you who use Excel 2010 and later, you can also use a feature called Slicers to filter multiple pivot tables at the same time.
Let’s look at a scenario where pivot tables can help you see what you want in your data at a glance. We have sales data for the entire first quarter.
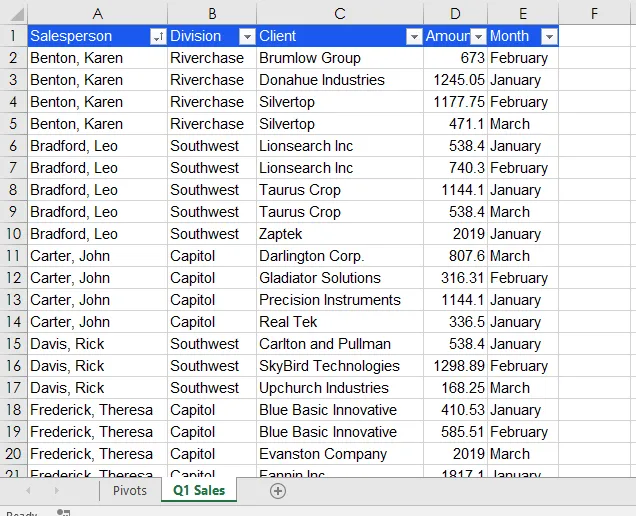
Note that we have five different data points to work with: Salesperson, Division, Client, Amount, and Month. This gives us a lot to work with and we are about to see how much flexibility pivot tables offer us.
GETTING STARTEDPosted from my blog with SteemPress : http://theexcelclub.com/how-pivot-table-and-slicers-bring-flexibility-to-your-data-visualization-needs/