Chart comedy courtesy of zerohedge
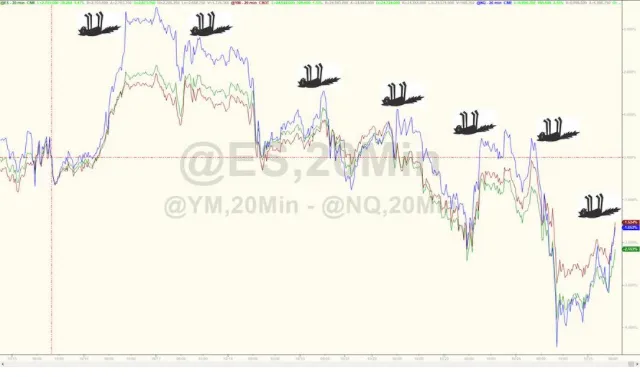
US indexes are up today after a big sell off yesterday again. The below analogy made me laugh, too true.

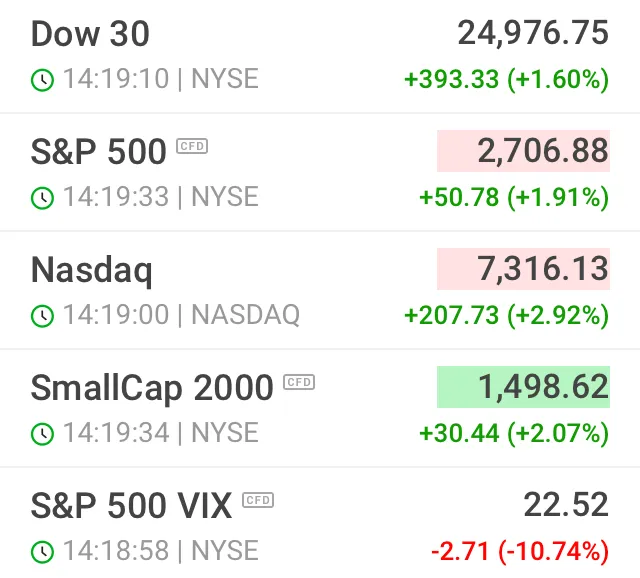
Here’s a look at US numbers
They’re trying to reach the levels from where they sold off from but seem to be establishing a firm sell off & soft dead cat bounce as seen below
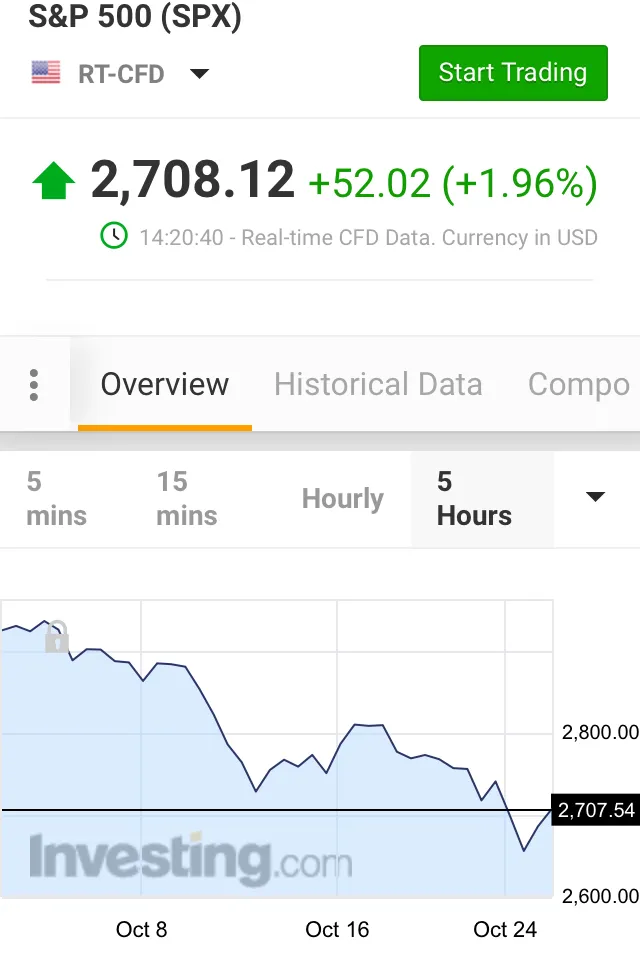
3% down days, followed by 2% up days is not a bullish trend.
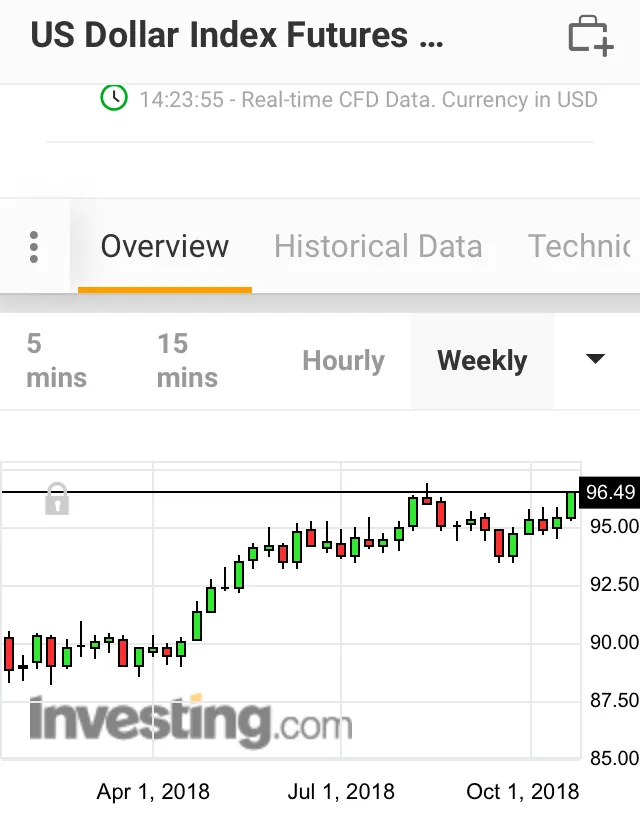
The dollar just keeps getting stronger all year, is this a reserve currency melt up?
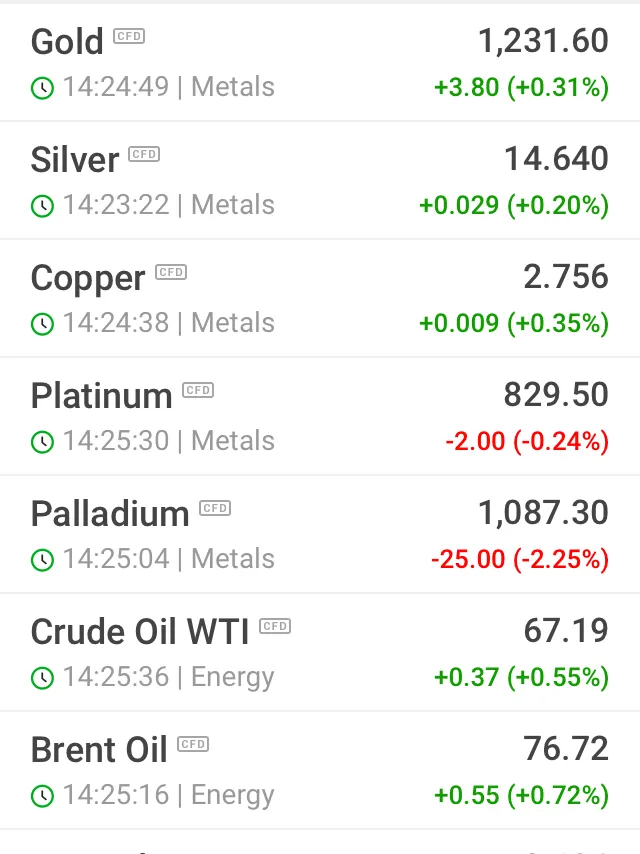
Gold & silver are still moving fractionally higher despite dollar strength & oil moving up even higher. Usually a strong dollar pressures these commodities lower.
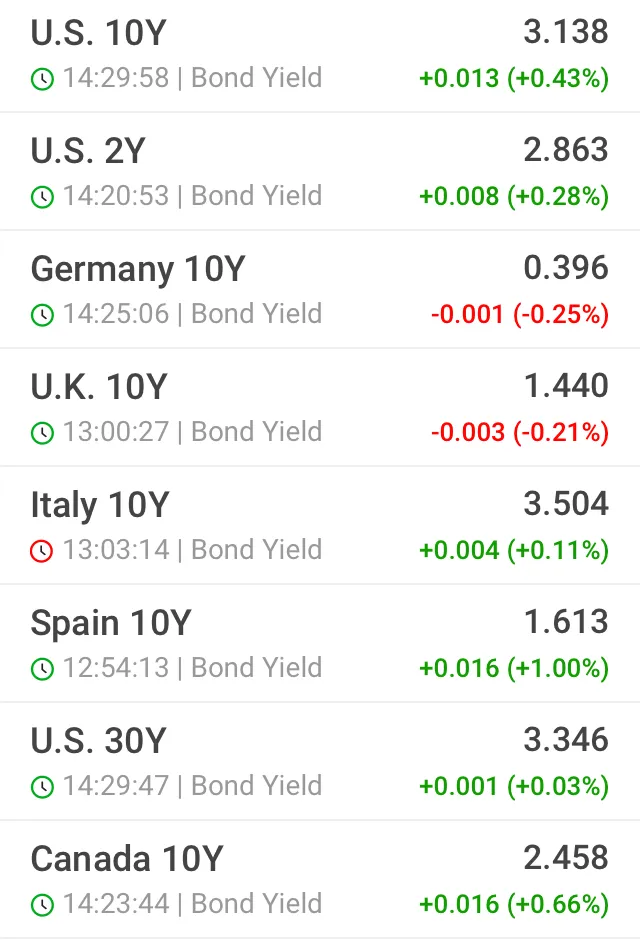
Bond yields aren’t moving around too much today, but the difference in change from the US30y to 10y is worth noting.
Red day for bitcoin & crypto’s.
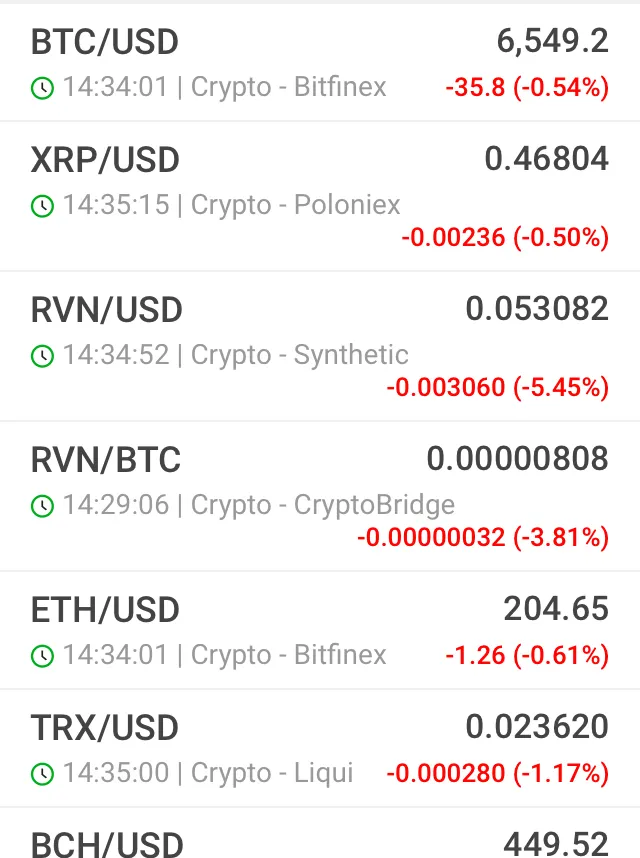
The crypto market is still reactive to the bigger economy as a whole. Crypto’s May have another 2017 type moment, but not before something breaks in the larger cap markets (bonds, stocks, metals) Keep watching the biggest market trends & hodl for a rainy day.
I think this site has a very interesting visual representation of market size. Slightly outdated but displays the point I was making about market caps above
http://money.visualcapitalist.com/worlds-money-markets-one-visualization-2017/
& a link to the zerohedge article I stole the chart humor from
https://www.zerohedge.com/news/2018-10-25/ssdd
That’s it for now, rainy day outside, good time to go to the gym & do some pool runnings

✌️