
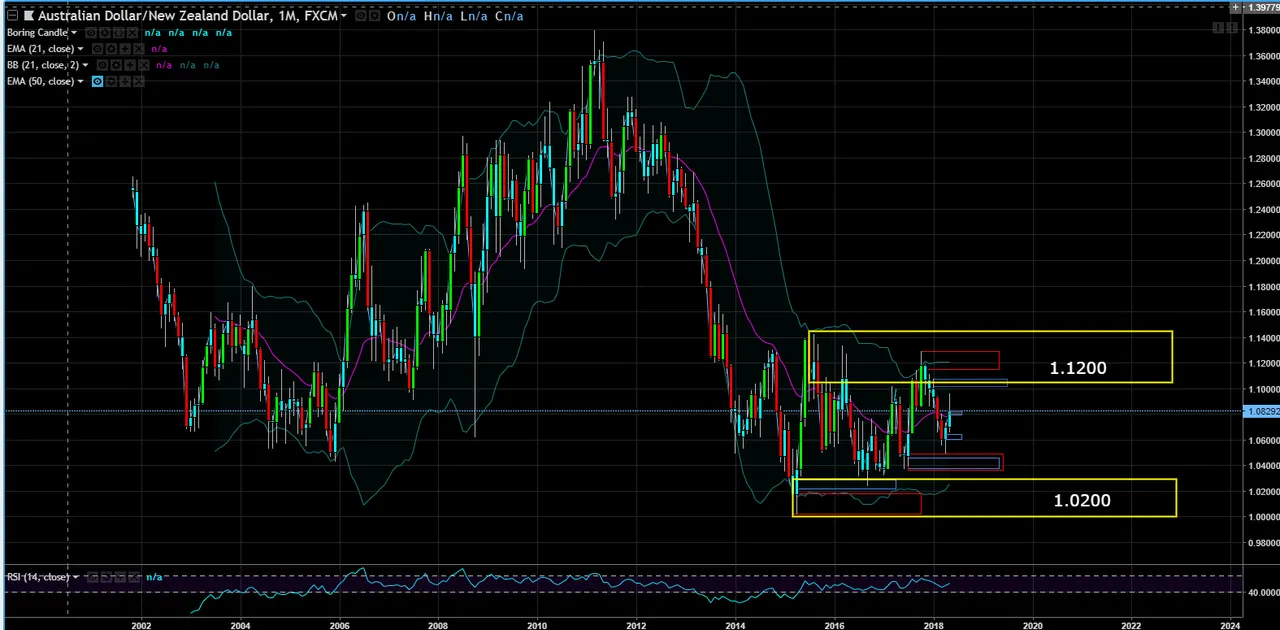
Monthly Chart (Curve Time Frame) - Price has been range bound since mid-2015.
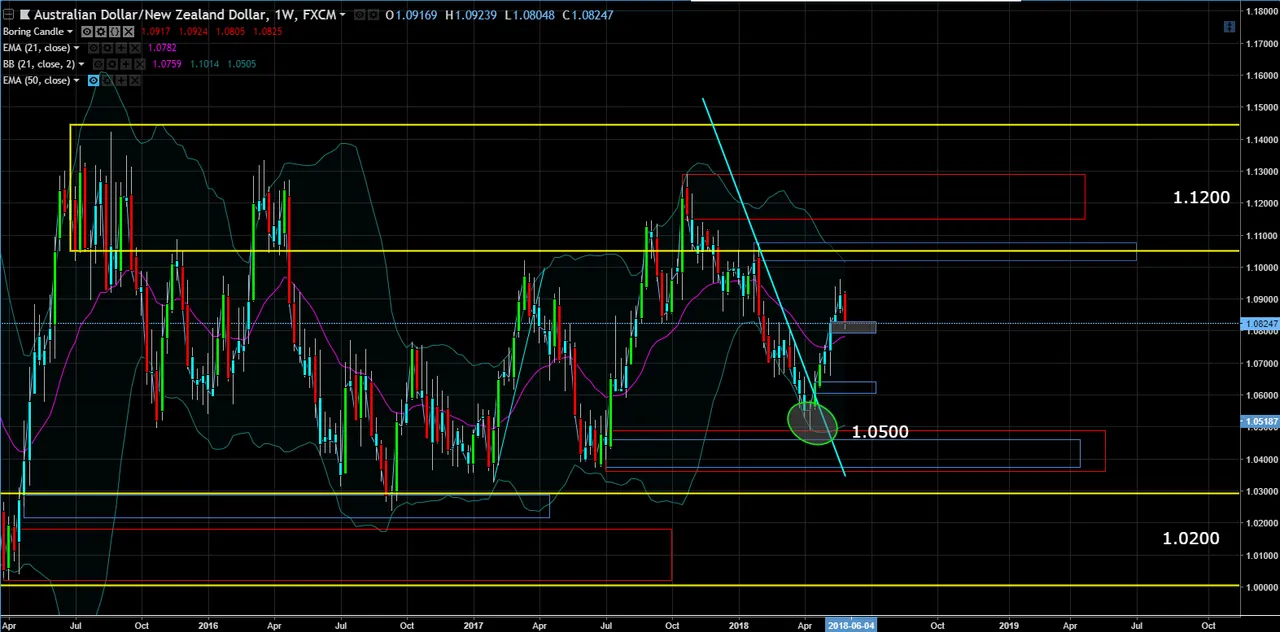
Weekly Chart (Trend Time Frame) – price broke a daily downtrend line at 1.0500 and has been forming higher lows since April, signifying the trend is up.
Daily Chart (Entry Time Frame) – price pulled back into a daily demand zone. I prefer to see more than one candle forming a demand/supply zone, but we had a strong move away from the zone indicated by the green extended range candle (the body of the candle was 2X the zone) and a candle that quickly approached the zone on the way back (the red extended range candle). Thus, I took a #2 entry which is known as a confirmation entry, meaning I was waiting for price to stop in the zone and react to the buy orders around the 1.0800 level.
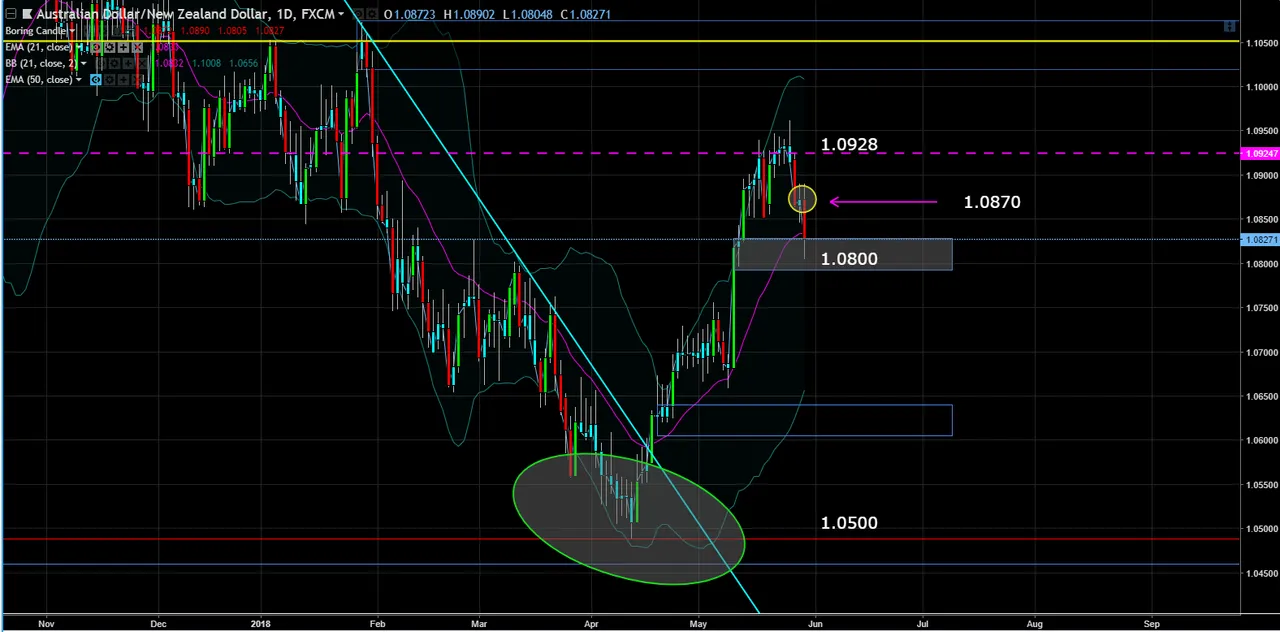
NOTE: if this trade has any chance of working out, it must take out the sell orders at the 1.0870 level first.
Risk – 1% of Account
Buying – 12 mini lots
Order – Market Order @ 1.0820
Stop Loss – 1.7910 or 29 pips
Target – 1.0920 or 100 pips
Reward to Risk Ratio - 3 to 1
This post is my personal opinion. I’m not a financial advisor, this isn't financial advise. Do your own research before making investment decisions.
