
SUMMARY
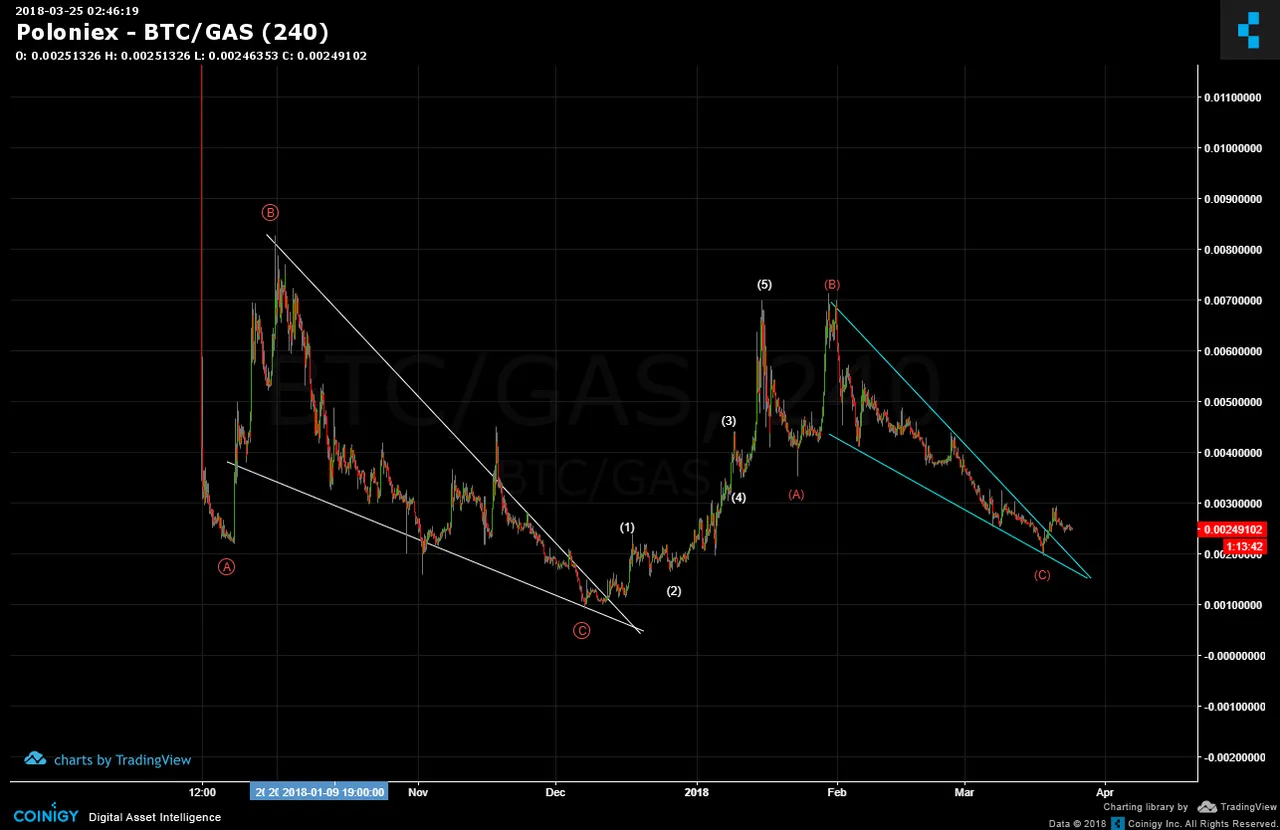
Overall, GAS/BTC price is moving sideways but within that channel is a pair of fractals and the first could provide a peak around the corner for next probable step assessments. As price brokeout of the first downward wedge, the second blue fractal could be about to do the same. There was a five wave up rise from the first fractal and closer look at the subwaves could indicate the early signs of a trend reversal.
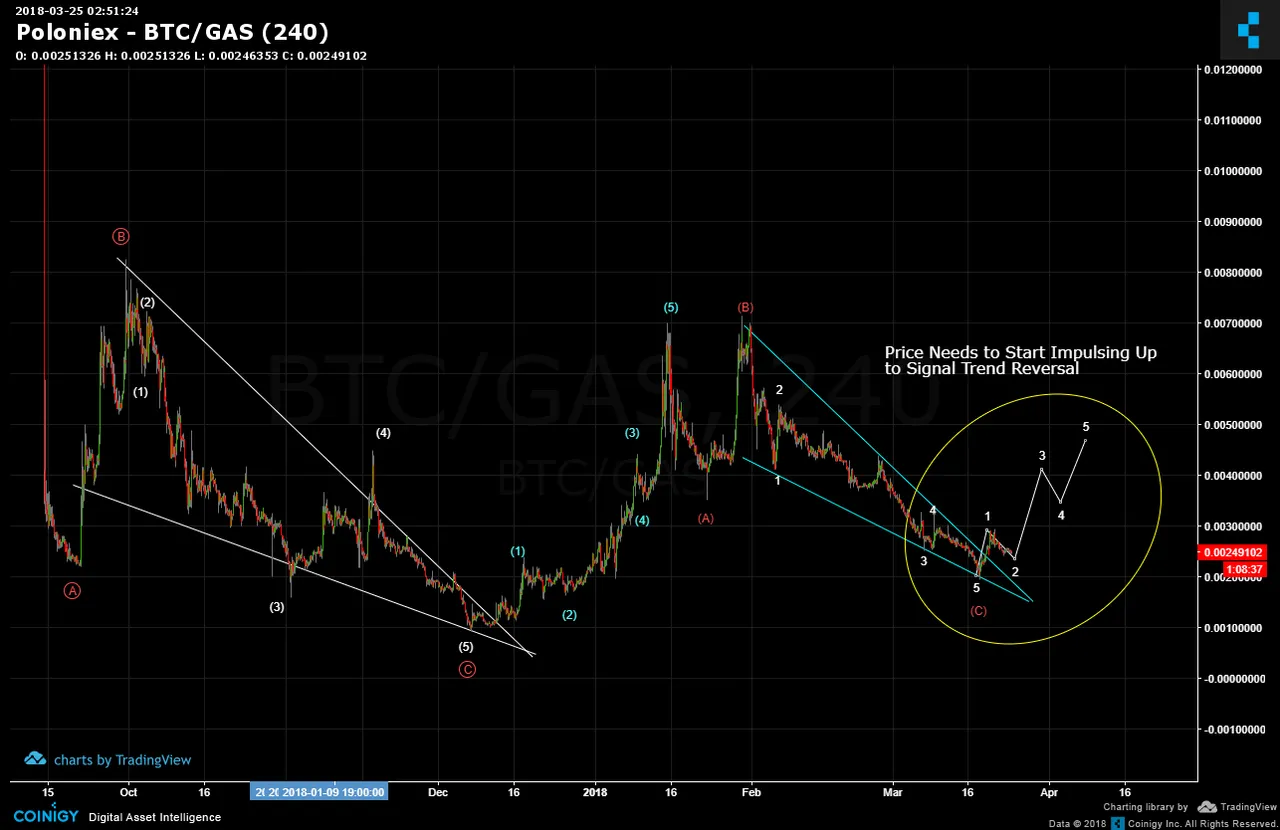
The blue fractal can be labeled with the abc (red) and the c wave sub-labled into fives. All five waves seem complete. IF the current move is a breakout; then an impulse must complete to provide the first signal of a trend reversal. Then, after a minor correction, a second full impulse needs to be placed. Those are the conditions to call a trend reversal.
Legal Disclaimer: I am not a financial advisor nor is any content in this article presented as financial advice. The information provided in this blog post and any other posts that I make and any accompanying material is for informational purposes only. It should not be considered financial or investment advice of any kind. One should consult with a financial or investment professional to determine what may be best for your individual needs. Plain English: This is only my opinion, make of it what you wish. What does this mean? It means it's not advice nor recommendation to either buy or sell anything! It's only meant for use as informative or entertainment purposes.
Please consider reviewing these Tutorials on:
Elliott Wave Counting Tutorial #1
Elliott Wave Counting Tutorial #2
Elliott Wave Counting Tutorial #3
Laddering and Buy/Sell Setups.
Laddering Example with EOS
Tutorial on the use of Fibonacci & Elliott Waves
@haejin's Trading Nuggets
Essay: Is Technical Analysis a Quantum Event?
Follow me on Twitter for Real Time Alerts!!
Follow me on StockTwits for UpDates!!
--
--

