The appearance of Neolithic concepts in Europe had important impacts on societies. People shifted from hunting and gathering wild plants towards domesticating plants and animals in order to secure their food. This process led to major changes in social structures, practices and land use around 10.000 years ago. It is assumed that Neolithisation originated in South Eastern Europe and spread westwards (Fort, 2015).
The Neolithic expansion into Europe was dependent from multiple factors such as population densities, farming practices and climate. The increase in population however was the main driver according to Bocquet-Appel et al., (2009). The spread of agriculture did not happen continuously but can be characterized by multiple spurt phases. On average expansion rates are 1 km per year but it would have ranged from 0.16 km to 30 km per year (Bocquet-Appel et al. 2011)..
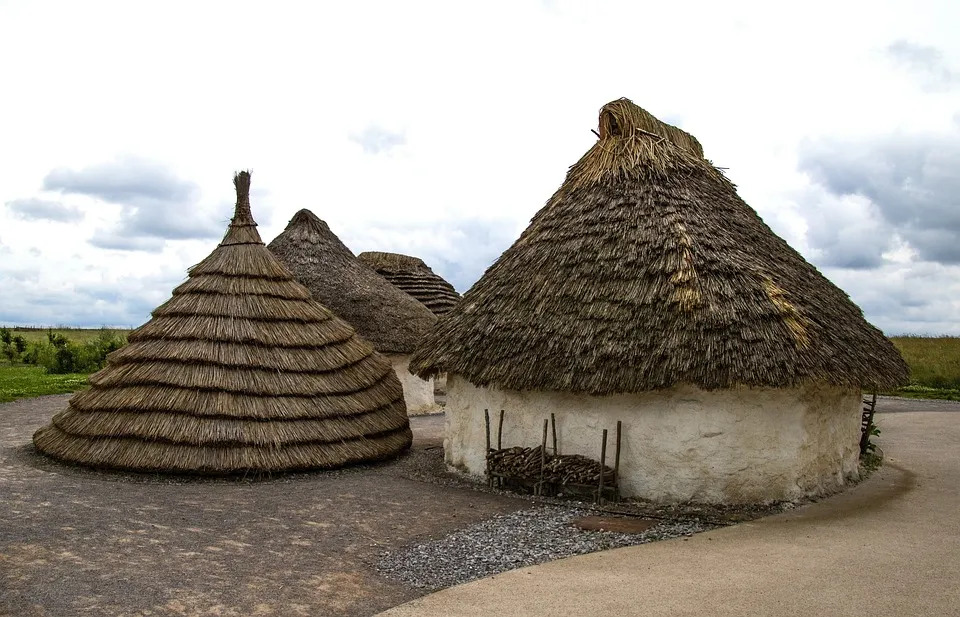
Reconstruction of a Neolithic village. Image shared under CC0
It is a fact that vegetation pollen can get stored under certain conditions where they do not decompose such as swamps or lake sediments. If at such locations a coring is done, pollen can be counted that have accumulated over millennia and their relative occurrence is a very good indicator of the historical vegetation composition. Combine this technique with radiocarbon dating and you can model historical environments.
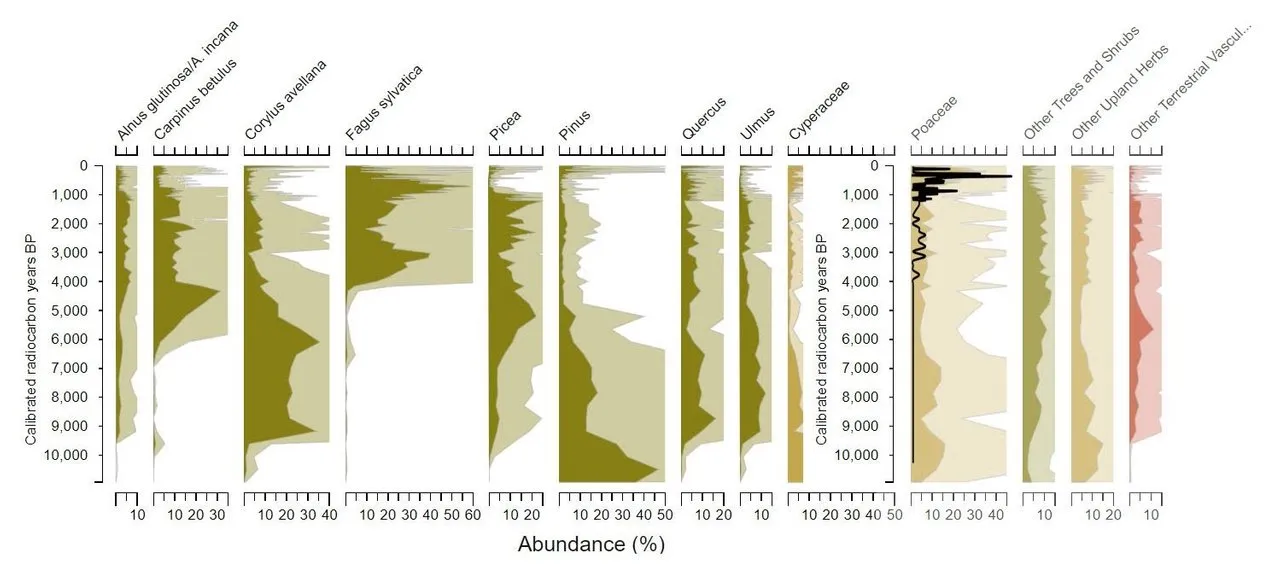
An example of a pollen diagram to visualize historical vegetation. Certain species decline and leave less pollen in sediments. This decline (or increase) in pollen can then be interpreted as changes in vegetation composition. Diagrams made with data from the European Pollen Database and the Neotoma data explorer.
I won't explain this technique to much in detail, but if you are interested I can direct you to this document that explains it further. What will be attempted here is whether these pollen data can be used to model the transition of Neolithic farmers throughout Europe.
Methodology and Data
The attempt to identify and date the Neolithic transition throughout Europe using pollen data is done using the European pollen database. By looking at certain species that are indicative for human agricultural practices, it can be estimated when humans arrived in these regions. When that certain species is detected in the pollen coring for the first time, the radiocarbon dated date is used as the date for first arrival. The species used as human indicators are:
| Latin name | Common name |
|
Avena |
Oats |
|
Centaurea Cyanus |
Cornflower |
|
Fagopyrum |
Buckwheat |
|
Hordeum |
Barley |
|
Linum |
Flax |
|
Poaceae (cereale) |
cereal cluster within the grasses family |
|
Secale cereale |
Rye |
|
Triticum |
Wheat |
|
Zea Mays |
Corn |
When doing this for the entire dataset (330 coring samples in Europe), the dates can be interpolated and compared to literature that uses starting points other than fossil pollen. This will then allow to conclude whether pollen records are a proper proxy to model the Neolithic transition.
Results
Using the pollen measurements we can already confirm certain knowledge about the Neolithic transition. Firstly it can confirm that agricultural practices started in the South Eastern corner of Europe around 8000 years BP and arrived gradually in Western Europe until 5000 years BP.
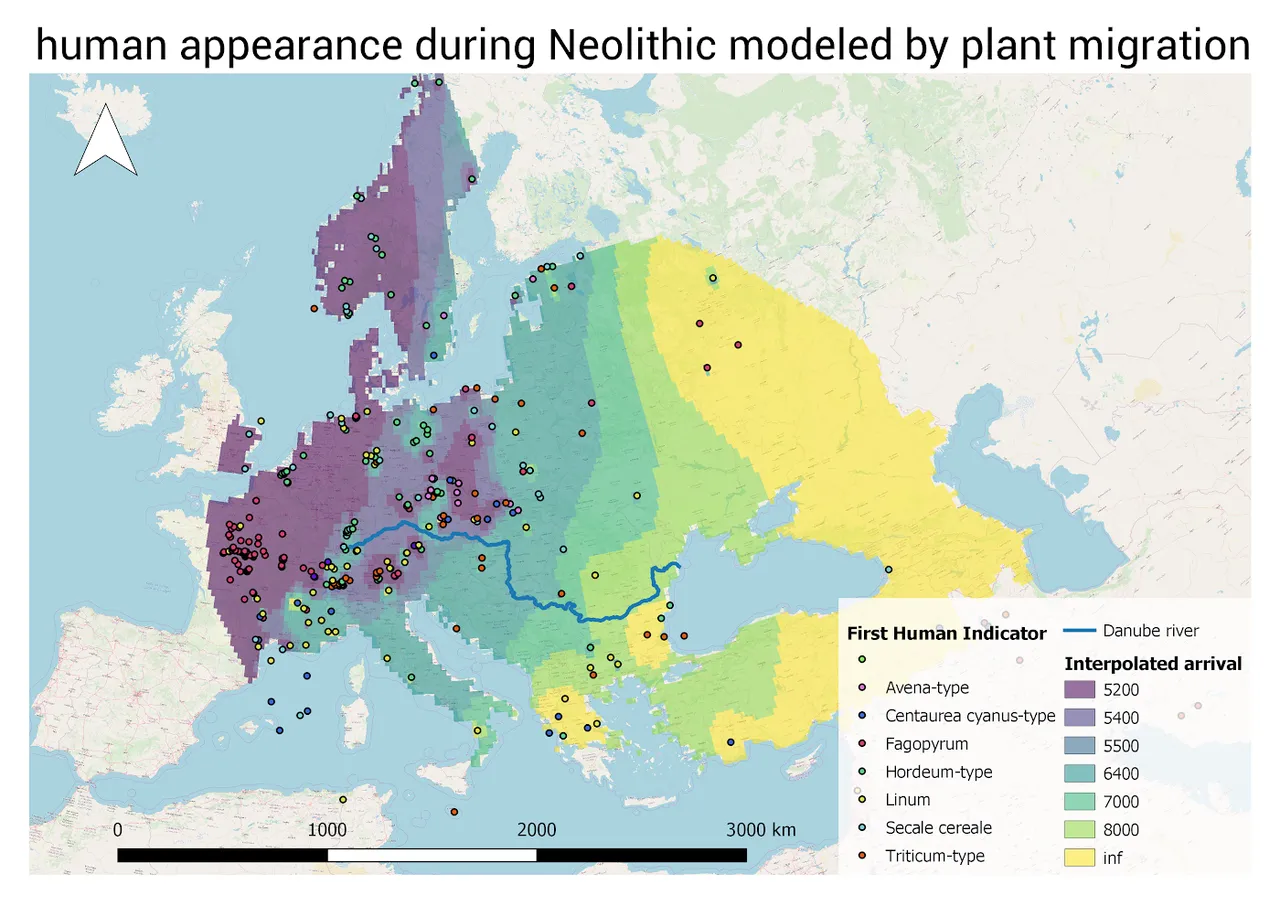
Human appearance during Neolithic modeled by plant migration: modeled arrival dates in Calibrated years BP of the first human indicator pollen over Europe (based on European pollen database and OpenStreetMap who shares data under the CC BY-SA licence)
Also the spatio-temporal variations that were suggested by Bocquet-Appel et al. (2011) can be seen using this model. in the 600 year time span between 6400 BP and 7000 BP for example, a similar amount of land was encompassed compared to the century between 5400 BP and 5500 BP.
Another trend that was observed in literature is that the Danube river and the Mediterranean sea were important highways for the transition to move into Europe and agricultural practices would start earlier near these water bodies (Tresset & Vigne, 2007). Also this is something that can be somewhat observed using pollen data. The regions close to the Danube river are characterized by relatively early arrival dates compared to other similar regions and measurements around the Mediterranean sea result in earlier dates than expected without taking this into account.
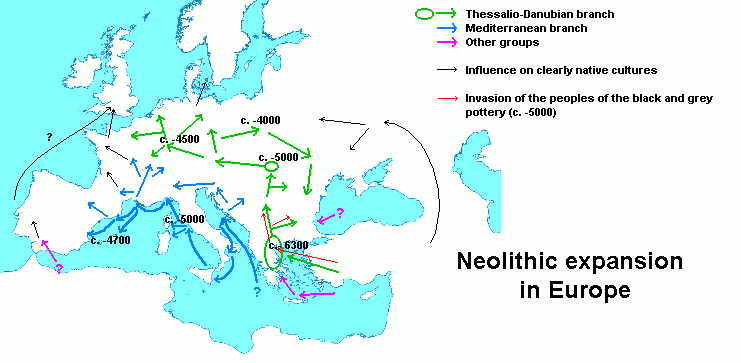
A model of the Neolithic expansion according to the model with two branches, a Danubian and Mediterranean branch. Image released in public domain.
The paper of Fort (2015) based on archaeological sites shows some time lag in the spread in the Alpine region with respect to the region around it. This is visible in the interpolation map. The convergence of the results indicate that pollen data is a good proxy for identifying Neolithic activities on a larger scale, but when looking at individual sites pollen data often deviates from present literature.
Is this a good model?
As mentioned already earlier, pollen measurements do not always correspond on a local scale. It is only when larger regions and a lot of data is interpreted that general trends can be observed. The map only shows a simple interpolation and complex features such as mountain ranges, seas or other geographical elements are not incorporated. In Northern Europe for example, the East - West transition is continued although based on the present data, this should be modeled as a South - North transition. For this a more elaborate model should be created which takes these factors into account.
Another assumption made here is the fact that the detection of a single pollen of a human indicator species is used as the arrival date of Neolithic civilization. Further research should be done to see if this is actually a good measure.
And finally it can be said that using only one proxy is almost never enough for understanding concepts at such a large scale. A lot of archaeological data is available and when compared with pollen in a proper model, better results can be expected.
Conclusion
It was fun to extract the data and make these maps. More data, pollen or otherwise, would have most likely improved the results and also a more elaborate model would have been able reduce errors. What do you think of these trends and methods? I'd gladly discuss them in the comments!

Sources
Ammerman, A., Cavalli-Sforza, L. (1971). Measuring the rate of spread of early farming in Europe. Man, 6, 674-88
Bocquet-Appel, J. P., Naji, S., Vander Linden, M., & Kozlowski, J.K. (2009). Detection of diffusion and contact zones of early farming in Europe from the space-time distribution of 14C dates. Journal of Archaeological Science, 36(3), 807-820.
Bellanger, S., Guillemin, J. P., Bretagnolle, V., Darmency, H. (2012). Centaurea cyanus as a biological indicator of segetal species richness in arable fields. Weed research, 52(6), 551-563.
Childe, V.G. (1942). What happened in history. Harmondsworth, UK: Penguin Books.
Edmonson, M.S. (1961). Neolithic diffusion rates. Current Anthropology, 2, 71-102.
Fort, J. (2015). Demic and cultural diffusion propagated the Neolithic transition across different regions of Europe. Journal of the Royal Society Interface, 12, 20150166.
Tresset, A. & Vigne, J.D. (2007). Substitution of species, techniques and symbols at the Mesolithic/Neolithic transition in Western Europe. Proceedings of the British Academy, 144, 189-210.
Tresset, A. & Vigne, J.D. (2011). Last hunter-gatherers and first farmers of Europe. Comptes Rendus Biologies, 334, 9-182.