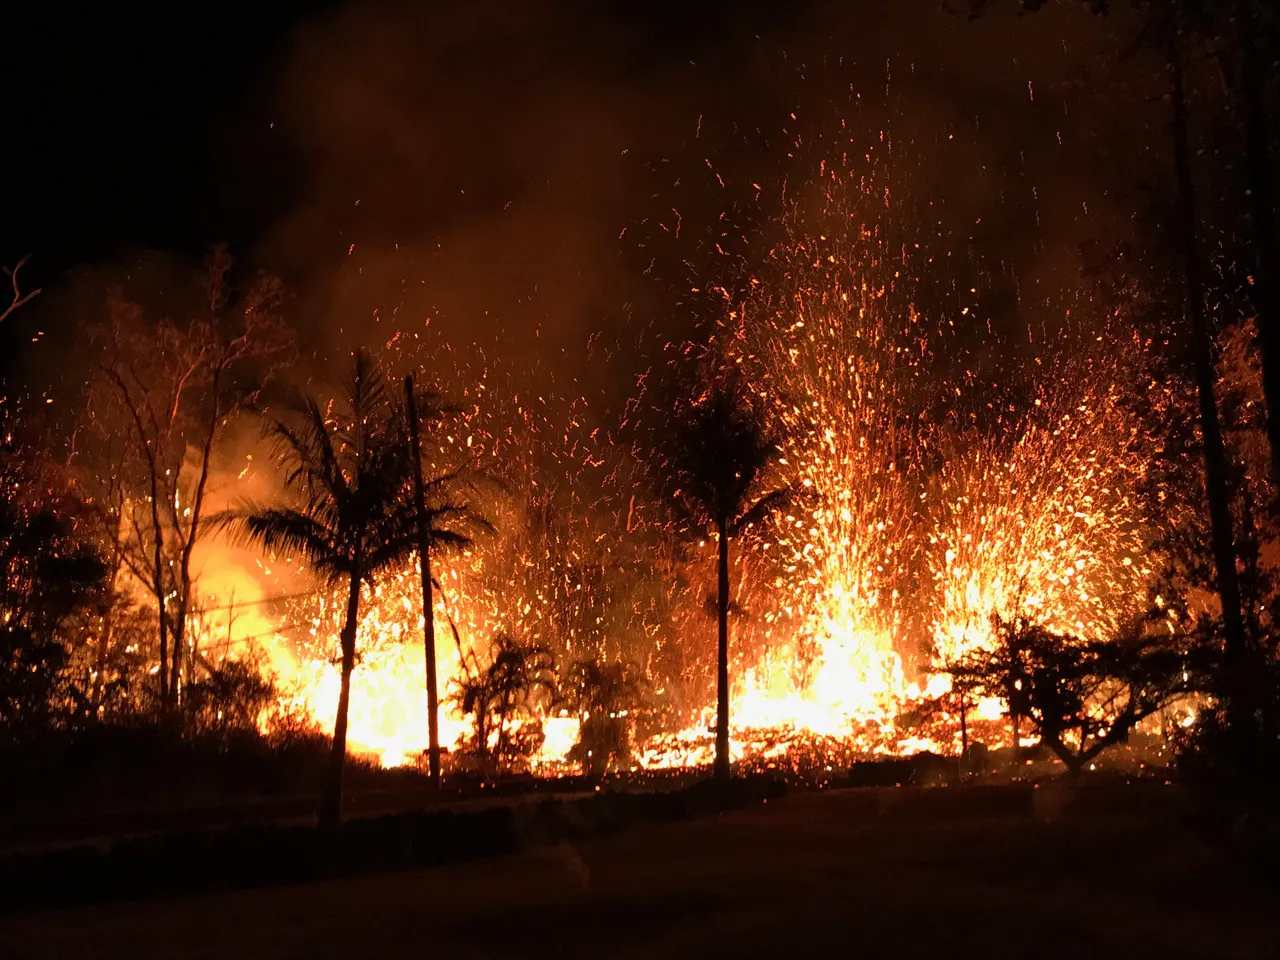
The volcano Kilauea in Hawaii has been actively erupting for nearly a week out of several new fissures that have opened in a residential subdivision known as Leilani Estates. These events and the geology of the Hawaiian Islands have been summarized in a series of posts by @Sooflauschig that you might enjoy reading if you are interested in learning more.
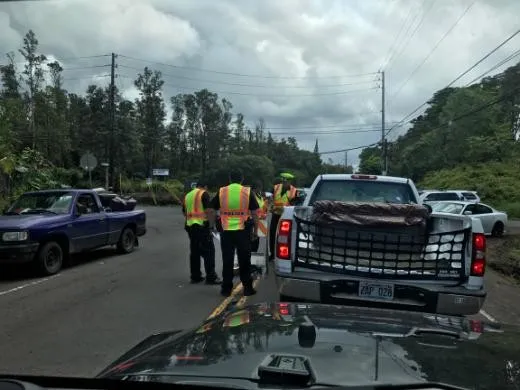 Road closure outside of Leilani Estates. Some residents are allowed to return to their residences to gather belongings during the day. Photo courtesy of Pau Hana Counceling, used with permission.
While lava flows are common in Hawaii, the current activity is somewhat unique in that it is occurring in a populated area and has already destroyed dozens of houses. As the action is ongoing and new fissures are opening continually, I thought it would be pertinent to do a spatial analysis of the region in an attempt to assess the risk that these fissures might pose if they begin erupting significant amounts of lava. Based on the continued seismic activity in the area, it seems that the eruptions are not yet over. Let's see how the power of GIS can be utilized to help forecast this disaster.
Kilauea Topography
In order to predict the direction of lava flow from the current fissures, we need be able to visualize the slope of Kilauea. There is elevation data available from the USGS, but the highest resolution Digital Elevation Model (DEM) is limited to 10 meters. Higher resolution data exists, but it is owned by a private company and is ridiculously expensive. For the purposes of this analysis, 10-meter resolution should suffice.
Upon obtaining the DEM, it was subjected to the slew of terrain calculations discussed in detail in my previous post Helping Communites 'Go Green'. With some light processing, the DEM was used to generate information on the slope, aspect, and terrain. Though lava is much more viscous than water, it still flows downhill in the same way (albeit much slower).
Overview
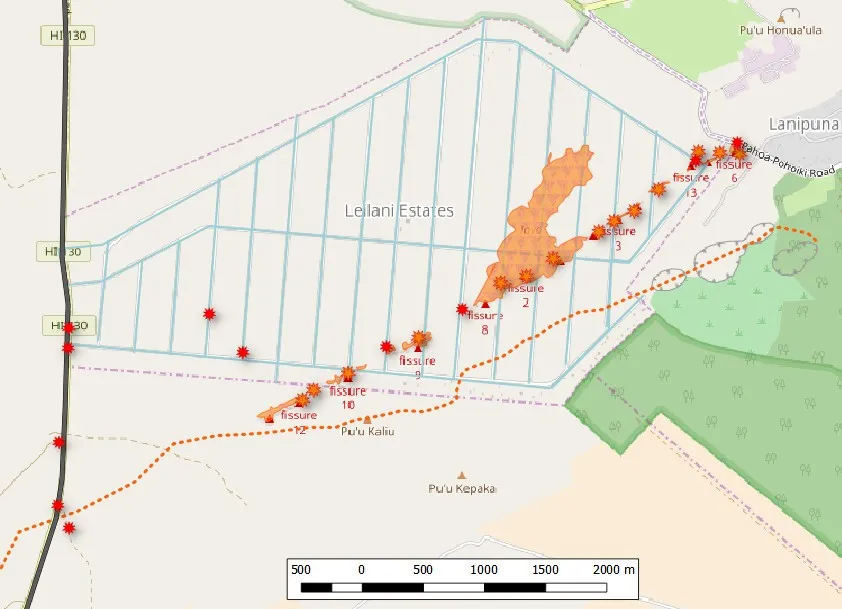 Overview of the recent fissures and eruptions on Kilauea. Active fissures are shown as orange stars, lava flow as orange polygons, possible future fissures as red stars, and the dashed orange line is a topographic high ridgeline. Roads in Leilani Estate are shown in light blue and Highway 130 is the dark gray line on the left side of the figure.
Leilani Estates is at the center of the current volcanic activity on Hawaii. The subdivision has hundreds of residents whose properties are at high risk of being overcome by lava flows and fire. The bulk of lava thus far has emerged from three fissures near the center of Leilani Estates and has moved over 1 kilometer downhill through the subdivision. Far to the west the red stars are locations where large cracks have developed in the road. The widening of these cracks suggest that fissures may develop here in the future. The fissures and cracks clearly follow a linear arcing trend running northwest / southeast, and they are all north of the dividing ridgeline created when this area experienced eruptions in 1955.
Elevation
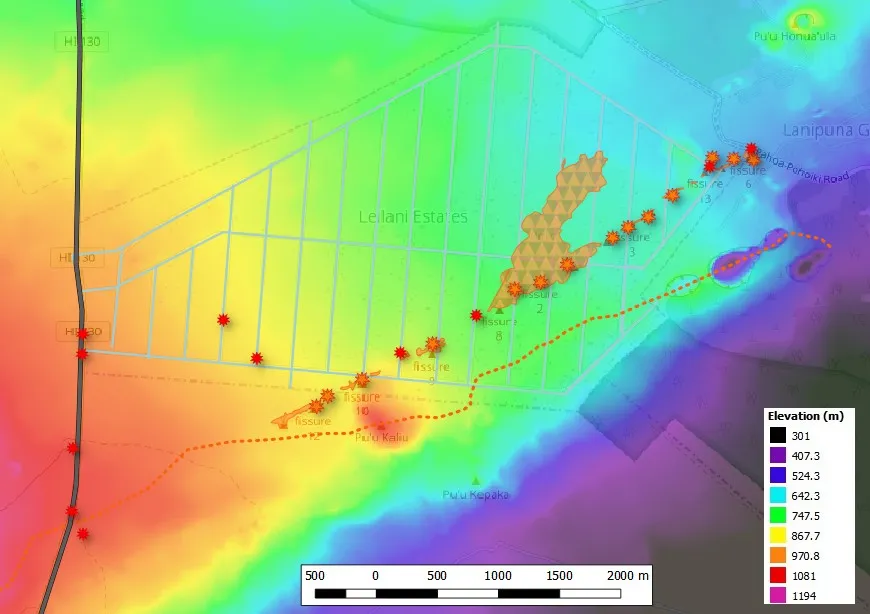 Elevation indicated by color. Warmer colors are higher elevation, and cooler colors lower.
The area of activity is located on the eastern flank of Kilauea, approximately 40 kilometers from the summit crater. The highest point in this figure is in the bottom left (southwest) corner, causing a general sloping trend to the northeast. However, the ridge created by the 1955 eruptions (approximated by the dashed orange line) acts as a topographic division, with steep hills sloping toward the ocean to the south. Any eruptions north of this ridgeline will result in lava being directed northeast toward Leilani Estates.
Slope
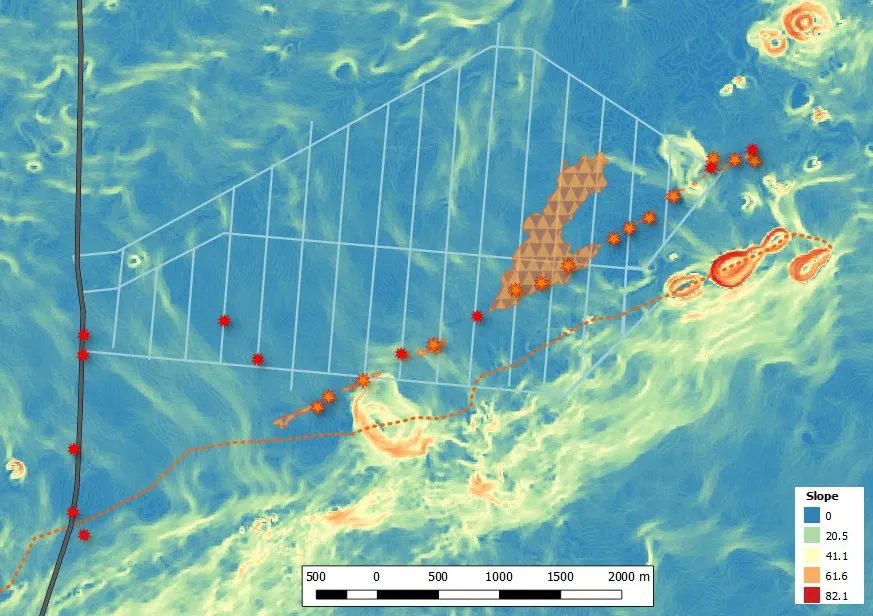 Slope or steepness of the land. Blues are the flattest terrain with yellows representing moderate slope and red the steepest.
As Hawaiian lava is exposed at the surface and loses heat, the viscosity gradually increases and the flow speed decreases. The steepness of the land has a profound influence on the rate at which any fluid material flows, especially as viscosity increases. In Leilani Estates, there are a few areas of moderate slope indicated by the northwest-trending yellow lines. Lava will tend to move downhill and perpendicular to these lines, but in flatter areas (shown in blue) the flow can spread laterally following the path of least resistance.
Aspect
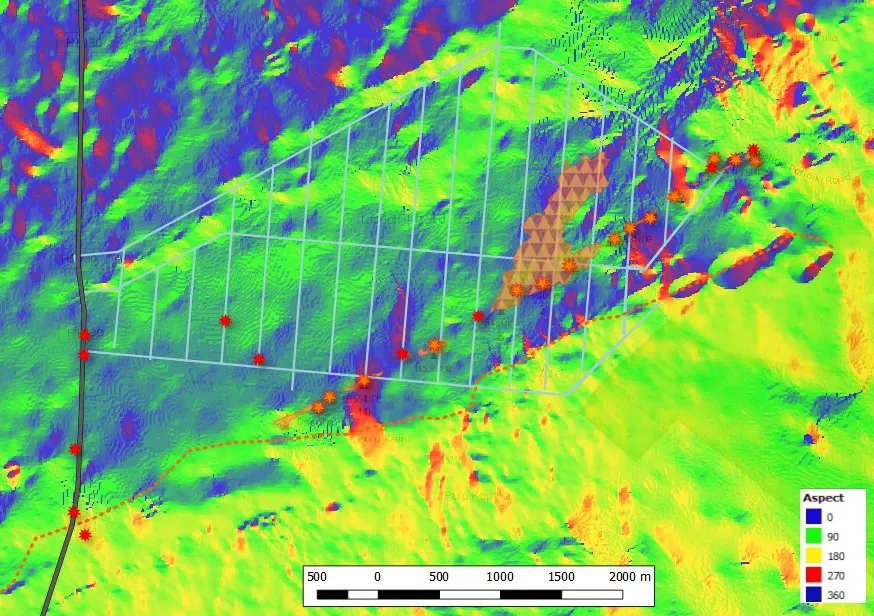 The four cardinal directions of aspect are represented by colors; Blue=North, Green=East, Yellow=South, Red=West
Coincident with the slope line analysis, aspect provides another way to quickly visualize the direction that the land is sloping. In this diagram, the majority of the fissures and nearly all of Leilani estates are colored in blue and green. This indicates that there is a general northeast slope downhill from the fissures. If the fissures had opened farther south on the other side of the ridge, the lava would flow south towards the ocean like it did in 1955.
Topographic Convergence Index
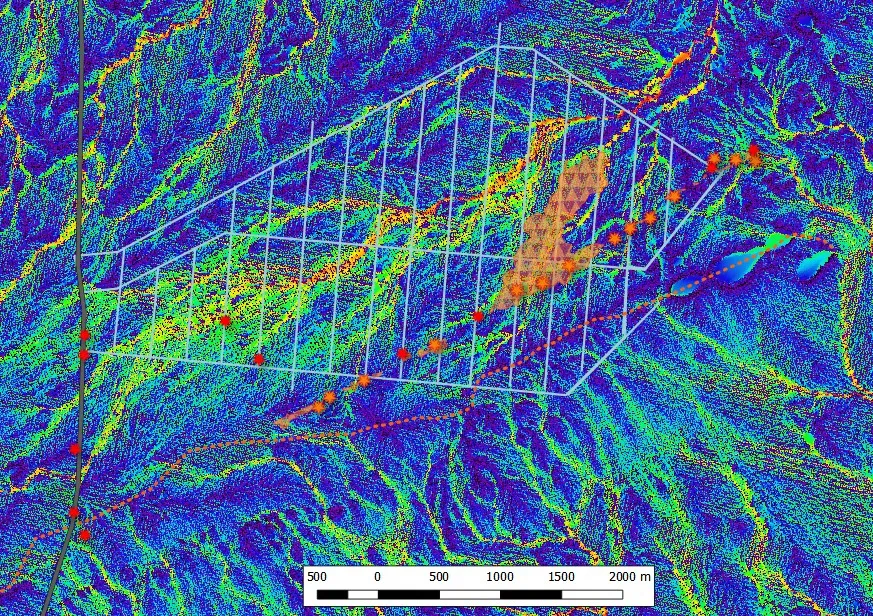 A Topographic Convergence Index based on the terrain showing the regions most likely to see flow in warm colors.
There is an elegant analysis in the GrassGIS terraflow module known as a Topographic Convergence Index (TCI). A TCI is essentially a guide for how the terrain will influence water flowing on the surface. It examines the elevation, aspect, and slope to determine the topographic basins and is useful for predicting how lava will flow. In the above figure, areas of yellow and red are the lower drainages that will likely be the route followed by any future flows. The sections of Leilani Estates that are at highest risk of future lava flows depends on which fissures or cracks become active next. Based on the positions of the current openings, a series of flow risk zones can be established.
Lava Flow Risk Zones
By synthesizing all of the information presented above and referencing the flows that have already occurred, it is possible to roughly predict where future lava flows might occur. For the residents whose houses are in the evacuation zone, they have a limited amount of time to return to their houses and retrieve items. This is not meant to be a comprehensive guide to what areas risk total destruction, but it is the best forecast that I can provide given the available data.
Moderate Eruption Zone
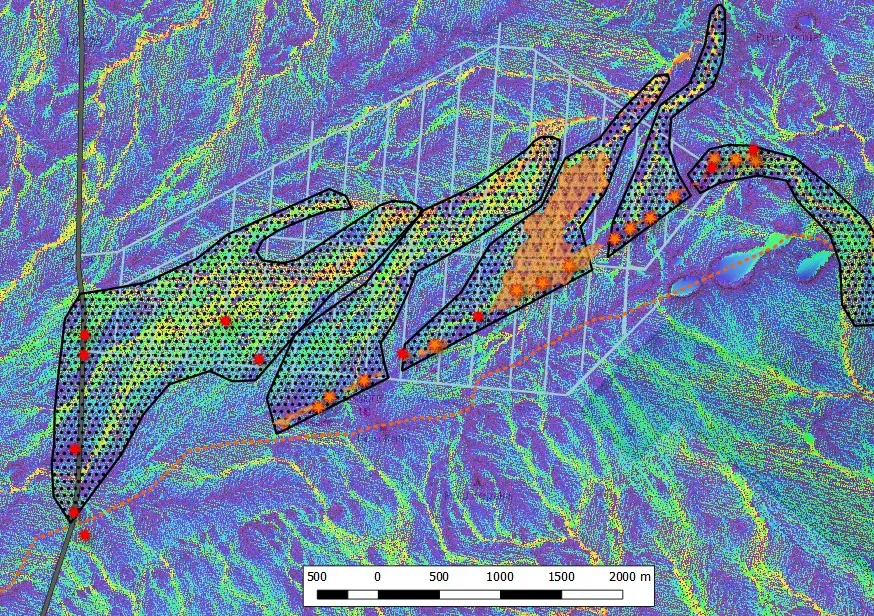
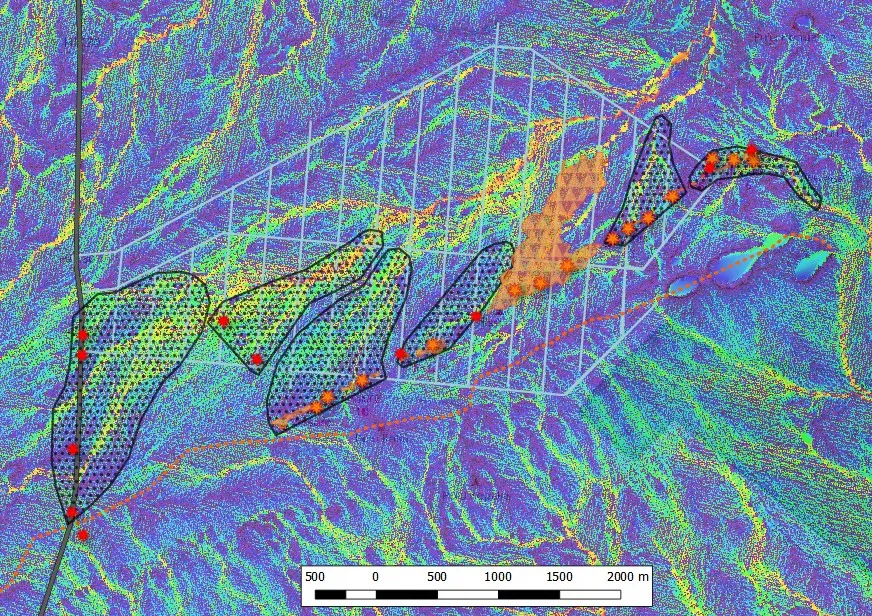 TCI map overlaid with an estimation of a moderate flow emanating from different fissure groups (black dotted polygon). Existing lava flows are shown as orange polygons.
The forecasting of a moderate lava flow is based on the existing flow shown as an orange polygon. The distance that it traveled in relation to the slope and aspect that it flowed across was used to predict a similar flow from the other fissures and cracks. Moving from right to left,
- The easternmost small cluster of fissures poses the least risk to Leilani Estates. The terrain is such that any flows would move east and then south toward the ocean. Unfortunately, several houses in the subdivision of Lanipuna Gardens are along this route.
- The next cluster will most likely flow due north if significant amounts of lava emerge. The streets of Kaupili and Mohala are along the immediate path of destruction.
- The third cluster includes the first fissure to open, and it is the only cluster that has released significant amounts of destructive lava. The extent of this lava flow is used as the basis of a moderate lava flow. Dozens of houses along Hookupu, Makamae, and Luana Streets have been buried under this flow.
- The small group of fissures and cracks in the middle of the figure will most likely flow northeast toward the existing lava flow. Upon encountering this lava, it will likely flow alongside or over top and continue to the northeast.
- The final cluster of existing fissures has started to erupt some lava. If the eruptions continue, the lava will likely start flowing to the northeast and threaten houses along the streets of Kumakahi, Alapai, Pomaikai, and Moku.
- The small cluster of two cracks has been emitting toxic gases, but has yet to open into a fissure. If it does, the flows will likely follow the drainage valley and travel east-northeast, crossing the streets of Maile, Oneloa, Kumakahi, Alapai, and Pomaikai.
- The final westernmost cluster of cracks have mostly formed across Highway 130 and are slowly growing wider. If these open into fissures, the flow would likely move northeast and threaten houses along Highway 130 and the streets of Kahukai, Hapuu, and Kula.
Large Eruption Zone
 TCI map overlaid with an estimation of a large lava flow that is approximately twice as long as the moderate flow. Hopefully this forecast will not be realized.
Assuming that these eruptions continue for weeks or longer, there could be extreme amounts of lava flowing from the fissures. The above figure gives a forecast of what this scenario might look like. Moving from right to left,
- The easternmost group of fissures would continue to flow southeast and may only reach the southern section of Lanipuna Gardens on Pohoiki Road.
- The next group of fissures would continue to move north out of Leilani Estates and move directly towards the Puna Geothermal Venture. The large amounts of explosive fuels stored here that are in the process of being relocated in case lava descends upon the area.
- The third group of fissures that are the source of the existing lava flow would continue to move to the northeast. Lava from the fourth group of fissures will likely overlap with this flow, moving alongside or over it and eventually flowing toward the Puna Geothermal Venture.
- The final group of existing fissures would continue to flow down the lowland drainage, crossing additional streets north of Leilani Avenue as it flows to the northeast.
- Lava flowing from the westernmost group of cracks would also follow terrain and move through the northern parts of Leilani Estates. It would probably converge with other existing flows as it moves northeast through the subdivision. The flow may split around a topographic high point and form two separate lobes.
Parting Thoughts
It is important to understand that this is just an estimation of potential lava flow risk based on an analysis of elevation and the most recent spatial data. Every property on the eastern slope of Kilauea is at risk of being damaged or destroyed if things get worse, and it is impossible to predict exactly where new fissures might open in the future. The predicted lava flow paths that are included make several assumptions in regard to the volume of lava being extruded and the barriers that it may or may not encounter. The primary concerns are not limited to lava; fire, earthquakes, and toxic gases also poses a real threat.
For residents who live in a mandatory evacuation zone, it is advisable to remove your most important belongings while you still can and be prepared for the possibility of losing everything. A remotely sensed analysis of terrain using a 10-meter DEM can only go so far in accurately predicting what will happen. As lava flows and hardens, they create new barriers that may completely change the direction of subsequent flows. The only thing that seems to be certain at this point is that this disaster is far from over. I wish the best for all who have been directly or indirectly impacted by these events, and especially to those on the Island. Feel free to share this analysis with anyone who might find it useful or interesting!External References
- Eruption News: USGS Kilauea News | USGS Kilauea Status | Hawaii News Now | Hawaii Tracker Public Forum | Alternative forum for residents
- GRASS Development Team (2018). Geographic Resources Analysis Support System (GRASS) Software, Version 7.2. Open Source Geospatial Foundation. Electronic document: http://grass.osgeo.org
- QGIS Development Team (2018). QGIS Geographic Information System Software Version 2.6 & 3.0. Open Source Geospatial Foundation Project. http://qgis.osgeo.org".
- Basemap used in some graphics © OpenStreetMap Contributors, under CC-BY-SA 2.0
- DEM Data: USGS 10-Meter DEM obtained through the University of Washington
- Fissure and flow Data: Community-generated map summarizing Civil Defense data, USGS data, and citizen reported information | Version 2
- Some information was obtained through direct communications with residents of the afflicted area.