
SUMMARY
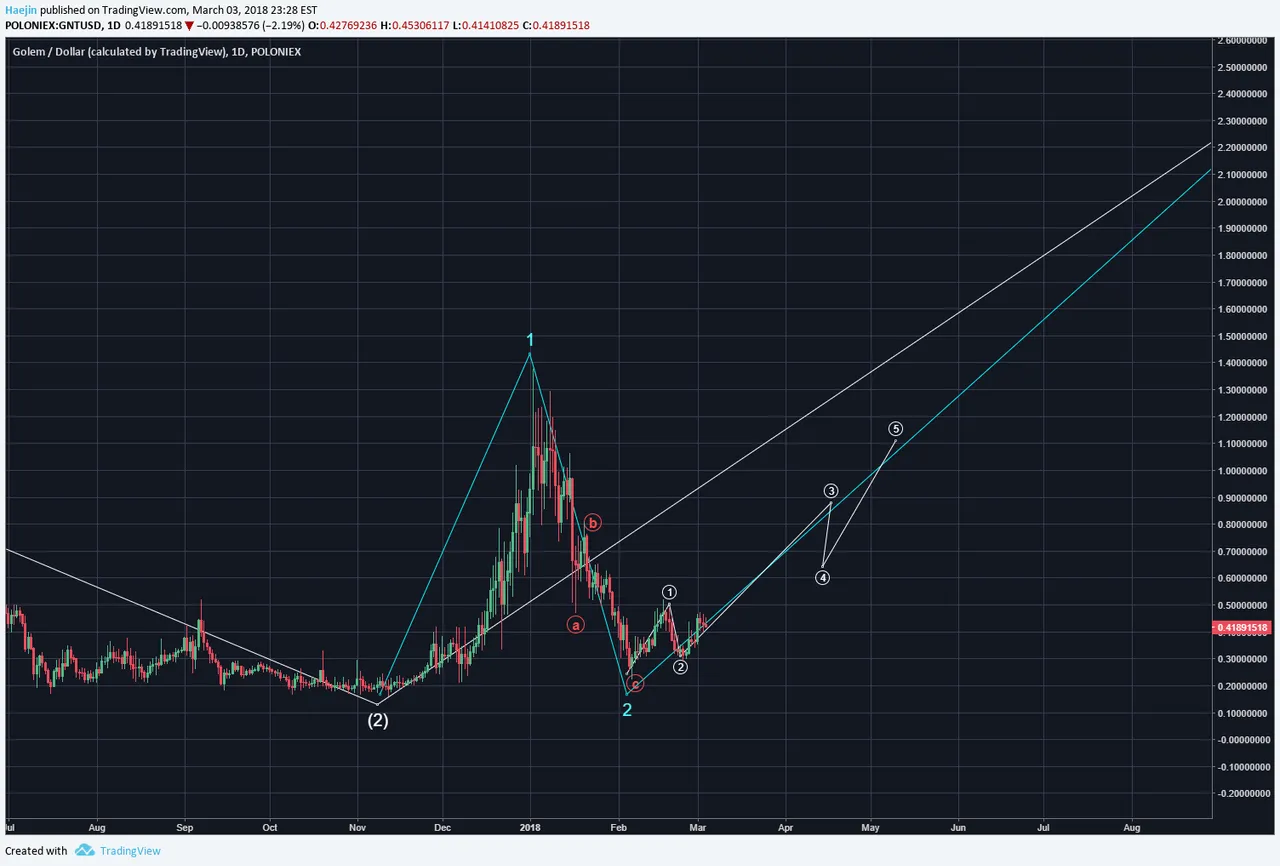
Over two weeks ago, the below chart was posted for Golem (GNT/USD). Many often ask why I trade or analyze primarily to the USD pair and not the /BTC pair. First, I trade to the /USD pair at daily or higher degree of trend. In other words, no in/out day trading. Second, the /USD pair has only a single variable, the change in demand for the coin. Third, the /BTC pair has two variables; the demand for the coin and the rate of BTC price change. This is why during an uptrend, the /BTC pairs often lag the /USD pair. Many who trade in /BTC pair have an objective of gaining as much BTC possible. However, perhaps more can be gained by using the /USD pair mechanism.
The below chart had given indications for a breakout from the downward pointing wedge. The initial impulse had een drawn.
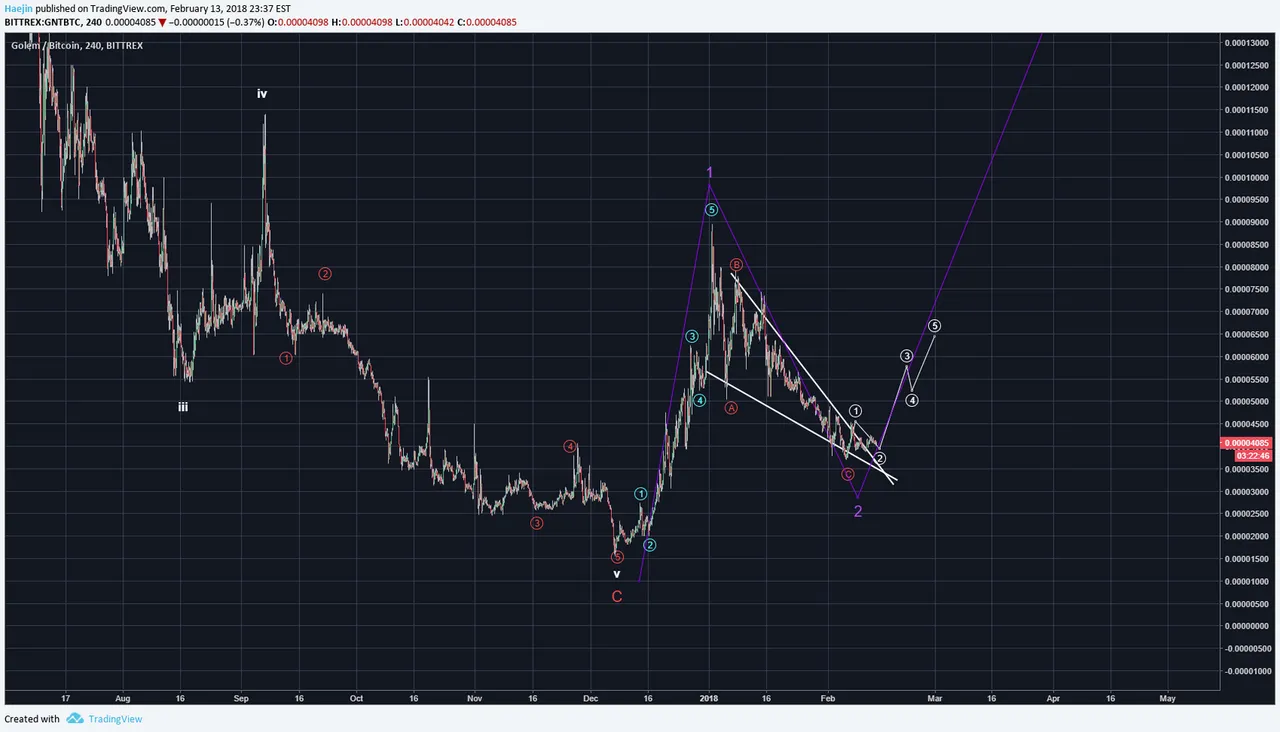
The wedge has broken upwards and the breach is established. The impulse waves upward have been modified to incorporate the wave 1 reference.
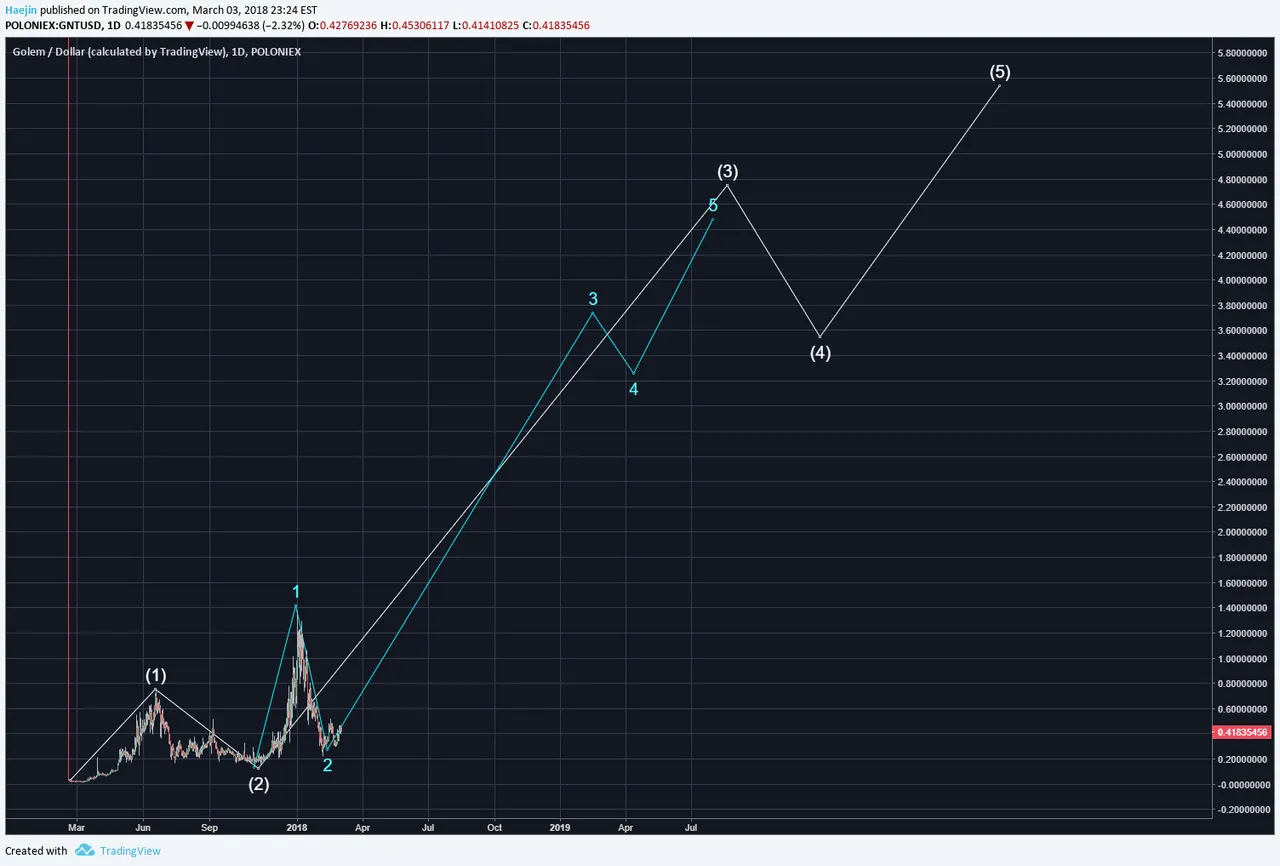
The longer term, "Forest" count is shown and however one's prior entry price migh have been; what matter does it make? HODL allows time to remove all the vestiges of "poor" price entries to still become profitable. So, if one had bought GNT at the peaky peak of blue wave 1; what matter would it make in due time, when price reaches wave 5? NONE!
Legal Disclaimer: I am not a financial advisor nor is any content in this article presented as financial advice. The information provided in this blog post and any other posts that I make and any accompanying material is for informational purposes only. It should not be considered financial or investment advice of any kind. One should consult with a financial or investment professional to determine what may be best for your individual needs. Plain English: This is only my opinion, make of it what you wish. What does this mean? It means it's not advice nor recommendation to either buy or sell anything! It's only meant for use as informative or entertainment purposes.
Please consider reviewing these Tutorials on:
Elliott Wave Counting Tutorial #1
Elliott Wave Counting Tutorial #2
Elliott Wave Counting Tutorial #3
Laddering and Buy/Sell Setups.
Laddering Example with EOS
Tutorial on the use of Fibonacci & Elliott Waves
@haejin's Trading Nuggets
Essay: Is Technical Analysis a Quantum Event?
Follow me on Twitter for Real Time Alerts!!
Follow me on StockTwits for UpDates!!
--
--

