Gridcoin has broken out of the triangle pattern in the four-hour chart.
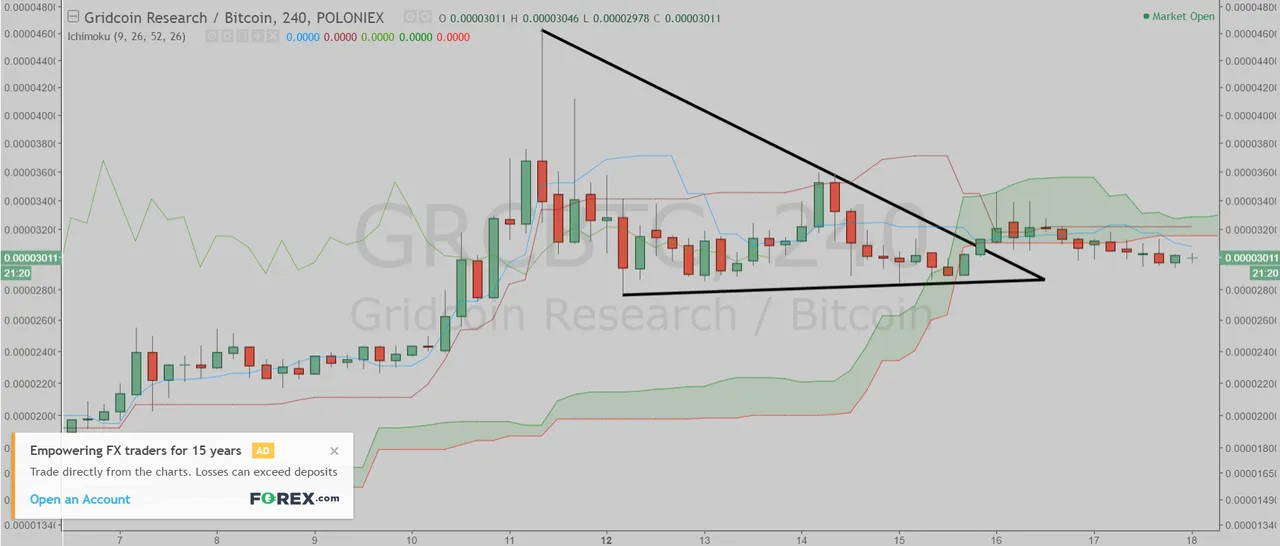
(Chart courtesy of Tradingview.com)
In Elliott Wave terms, Gridcoin began a wave one advance on May 27. The wave one finished on May 29, and the wave two correction ended on May 31. The wave three advance finished on June 11, and the wave four correction ended on June 12. If this wave count is correct, Gridcoin should be heading next towards the June 11 peak in the wave five.
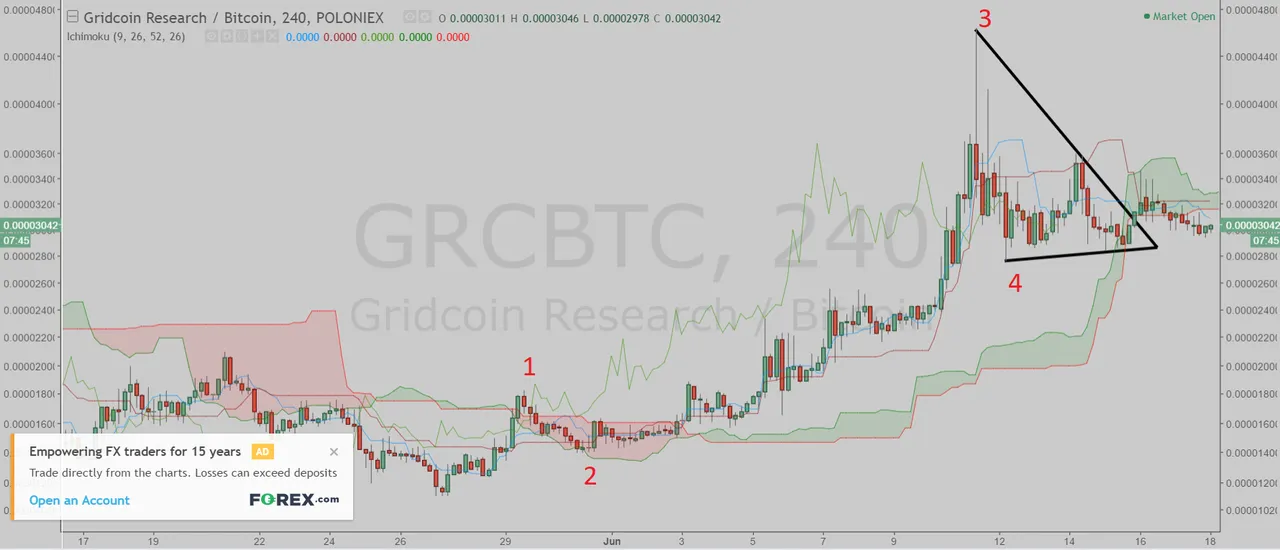
(Chart courtesy of Tradingview.com)
Looking at the daily chart, I believe Gridcoin is currently in the wave three.
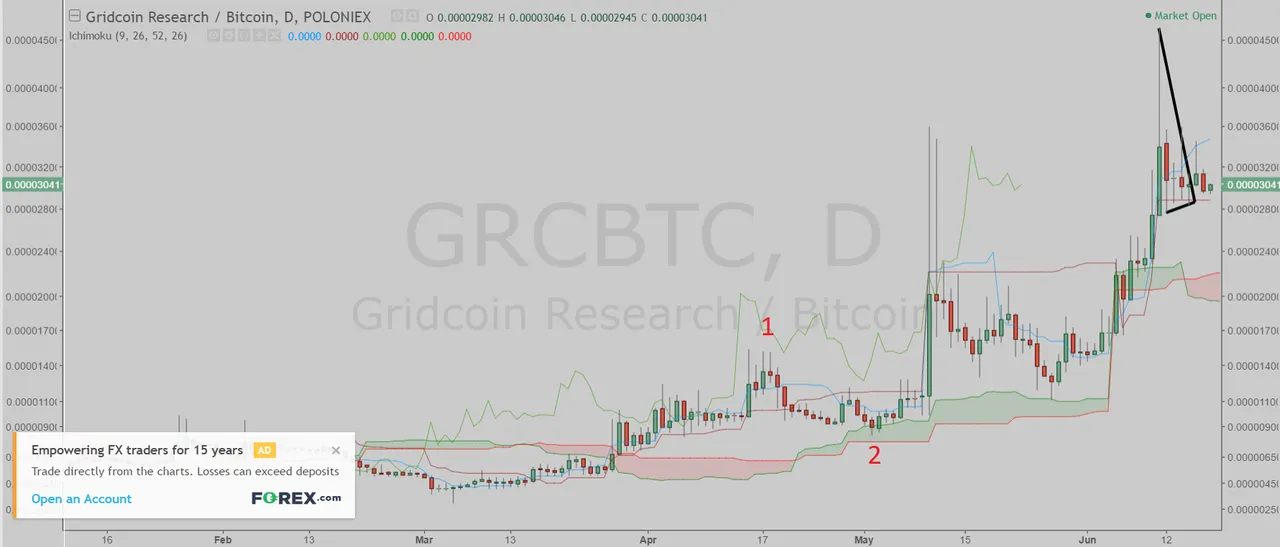
(Chart courtesy of Tradingview.com)
At the weekly chart, Gridcoin is also currently most likely in the wave three.
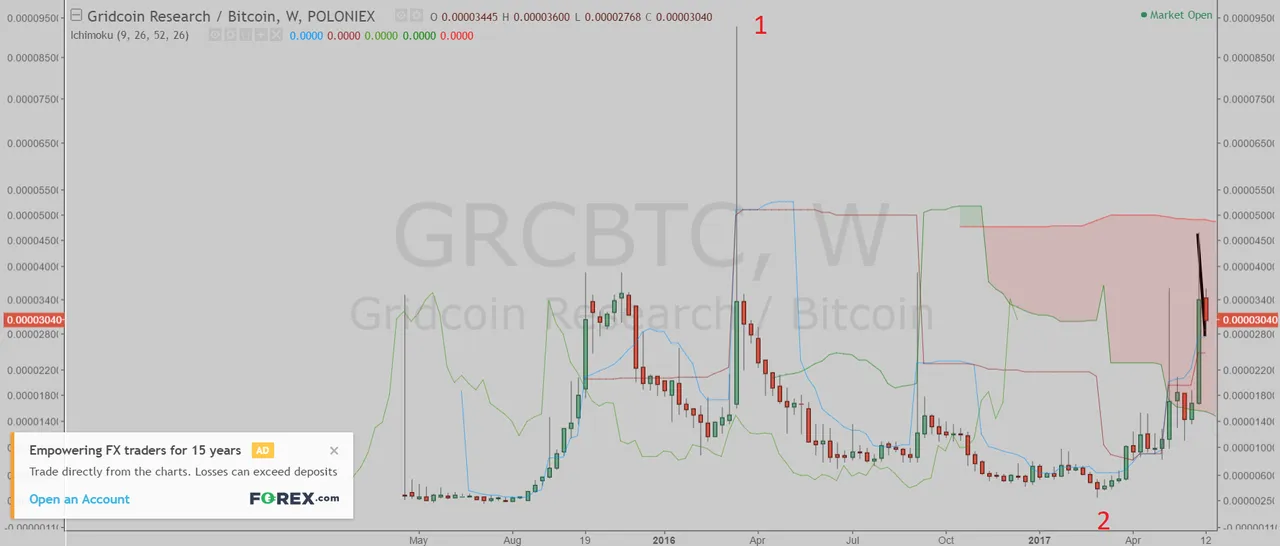
(Chart courtesy of Tradingview.com)

If you think this analysis is correct, upvote this post and upvote the comment "Gridcoin will takeout the June 11 peak".
If you think this analysis is wrong, upvote this post and upvote the comment "Gridcoin will drop below the May 31 low".
If you think Gridcoin is in a range, upvote this post and upvote the comment "Gridcoin will stay in a trading range between the May 31 low and the June 11 peak until July 18".
You can upvote the comment until 3 PM EST June 19 and you can upvote only one comment. 50% of SBD from this post will be distributed equally to the winners. The winners will be determined by the price action (which one happens first). Only participants with a Reputation of 35 or more will qualify in the contest.