Today, I decided to continue with my charting on hump day.
So we now have #HPCD #2 where I share a few charts of some tokens I am following.
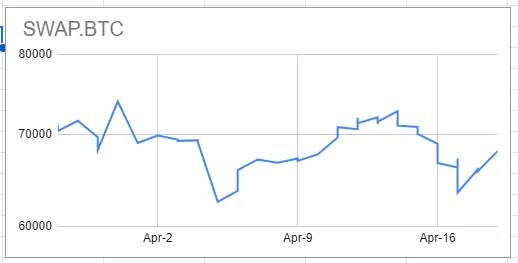
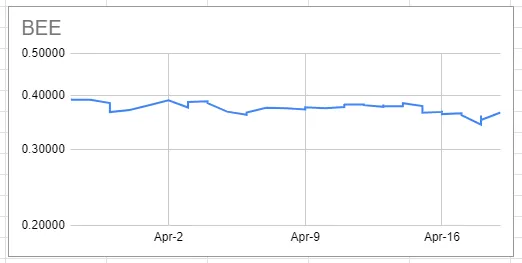
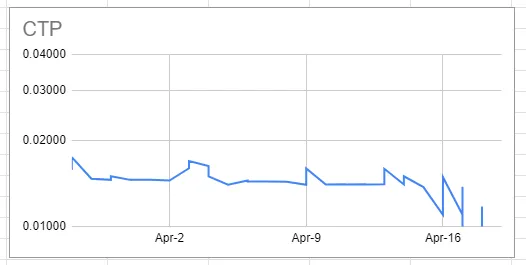
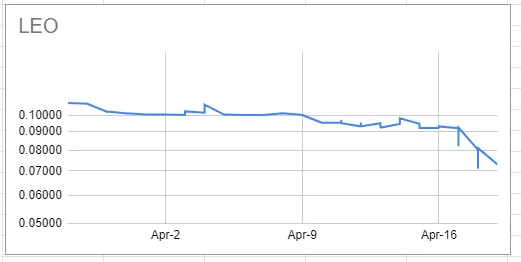
Again, the time frame is only recent. It is a snapshot of about one month. The vertical axis is exponential to show more sensitivity in the price movement.
Let's have a quick look at BTC. A couple of days ago I found out about the weekly btc guessing game.
Guess the price of BTC
This is my guess. @spinvest

I am guessing low compared to other entries. Let's have some fun and play the game. Can't hurt too bad.
Time to save and earn some BEE for later use.
#CTP is still searching for a support level. Need more time and data to help with analysis and determine a confident level as per future direction.
#LEO for some reason is very similar to CTP from a technical analysis view.
I have added #ALIVE to my portfolio and started the data collection phase.
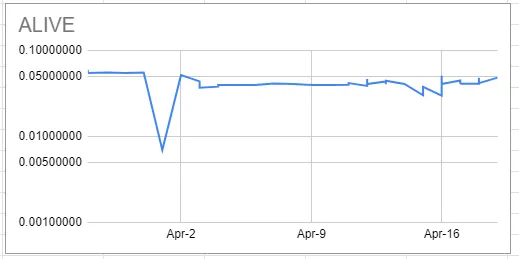
As mentioned last week, these charts are my baseline. My As-Is representation. As we move along our journey, the charts will become more informative as we link the trading response of holders to the perception of the underlying value of the token.
Disclaimer: You can do what you want with this information. It has nothing to do with me telling you what you should do with your own token holding. Your holding and trading activity is your decision. The purpose of sharing these charts is to give a perspective of perceived value based on trading data and to consider if there is alignment with deliverables associated with the purpose of the token.
Have an awesome day and please consider participation in our #PEPT traffic exchange community.