Hi there. This math/stats/probability post is on estimating (or approximating) the value of Pi with Monte Carlo simulations.
The follow up for this post will feature an interactive web application I made in RShiny. It features a plot and an estimate for the value of pi.
Screenshot of image were from this website.
Math text rendered with QuickLaTeX.com.
A Monte Carlo simulation is a statistical simulation which involves random number generation, random variables and probability distributions. Most theorems, Lemmas and concepts are named from the founder/mathematician/physicist but the name Monte Carlo is used as a reference to the casino in Monaco.
One popular area where these simulations are used is in finance for asset pricing, risk management. With Monte Carlo simulations, you can "simulate" possible stock price movements in the future in order to price a financial instrument such as a stock option for the present time. The mathematics and probability is very advanced. Look for books like Stochastic Calculus for Finance By Steven Shreve if you are really interested.

Approximating Pi As A Ratio Of Area Of Circle Over Area Of Square
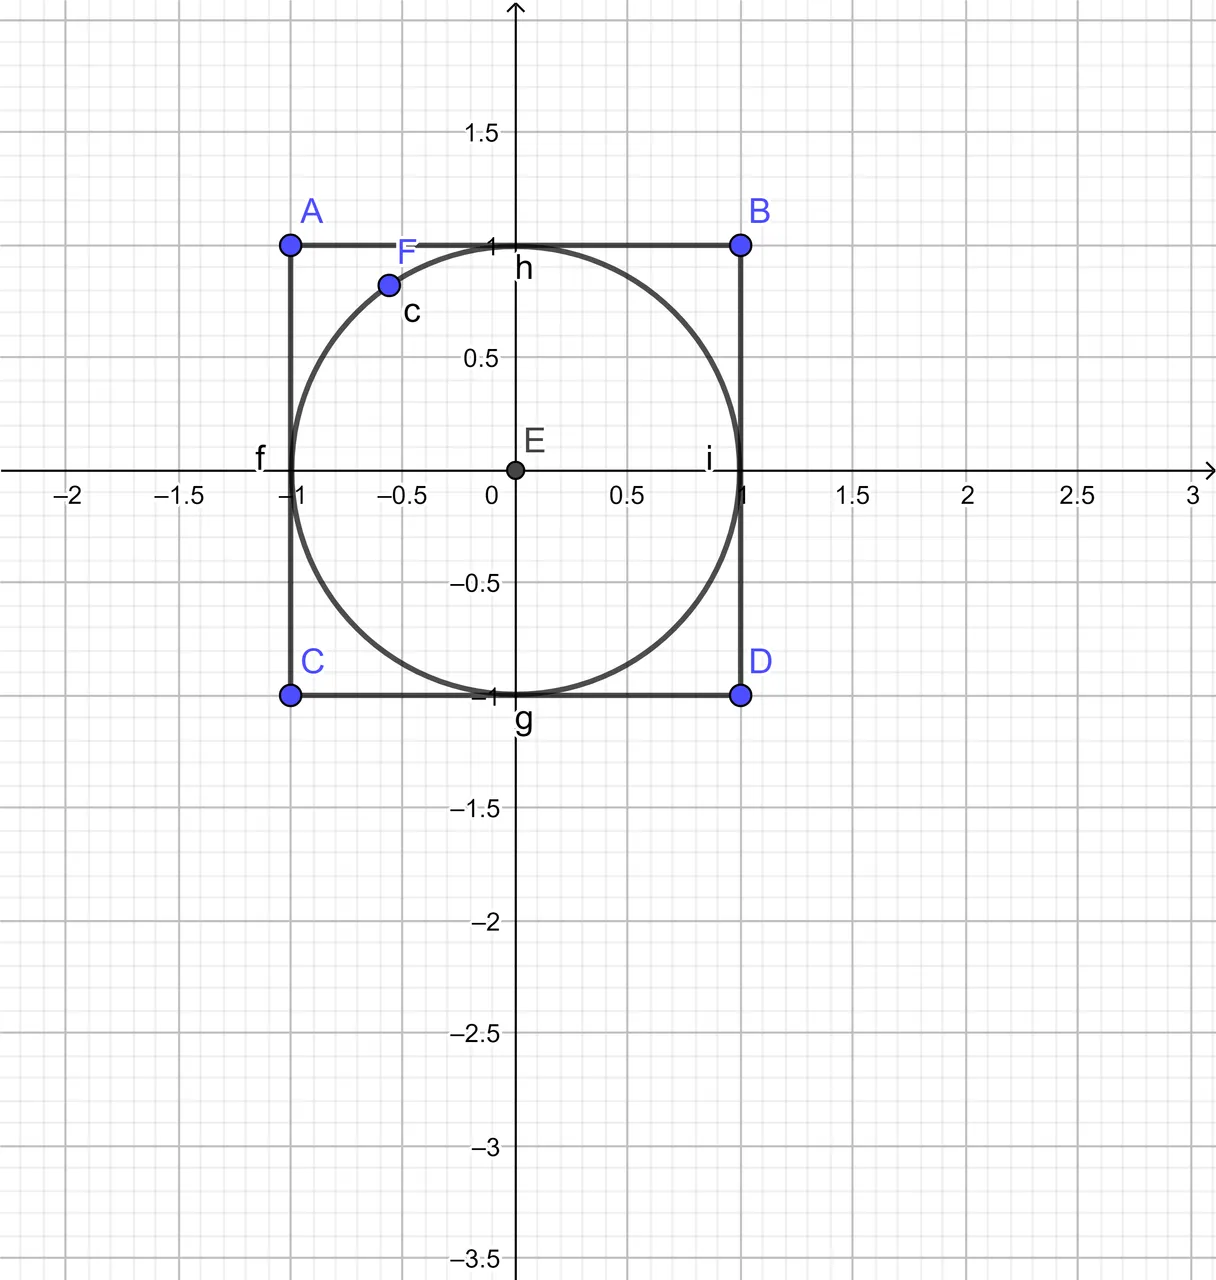
The irrational number Pi is one of many famous numbers with never ending digits. With a Monte Carlo simulation, the value of Pi can be approximated. The idea is based on the ratio of a unit circle's area over the area of a two unit by two unit square. This unit circle with (0, 0) origin is inside the 2 by 2 square. The square corners are located at (1, 1), (1, -1), (-1, 1) and (-1, -1).
The unit circle area is  from
from  and the area of the square is 4 square units from 2 times 2. This ratio turns out to be:

Rearranging for pi gives this equation:


Using Monte Carlo Simulations For Estimating Pi
Monte Carlo statistical simulations can be used for estimating pi. Uniform random variables are used to generate points within the 2 unit by 2 unit square. A point can be simulated from two uniform random variables from -1 to 1. One uniform random variable is for the x-coordinate and the second random variable is for the y-coordinate.
A generated point lies within the unit circle (that is inside the square) if  . If this point is not in the unit circle, this point just counts as a point in the square.
The ratio idea from before is used to estimate pi. This ratio is the number of points divided by the number of simulated points (or points in the square). Multiplying this ratio by 4 gives the estimate for pi.

From the frequentist statistics perspective, an increased number of simulated points leads to a more precise (or "better") estimate of the true value for pi.
A Slight Variation
This simulation also works if the circle has a half unit radius (or a unit length in diameter) with a center at (0.5, 0.5). The square which surrounds the circle is a one unit by one unit square. This square has corners at (0, 0), (1, 0), (0, 1) and (1, 1).
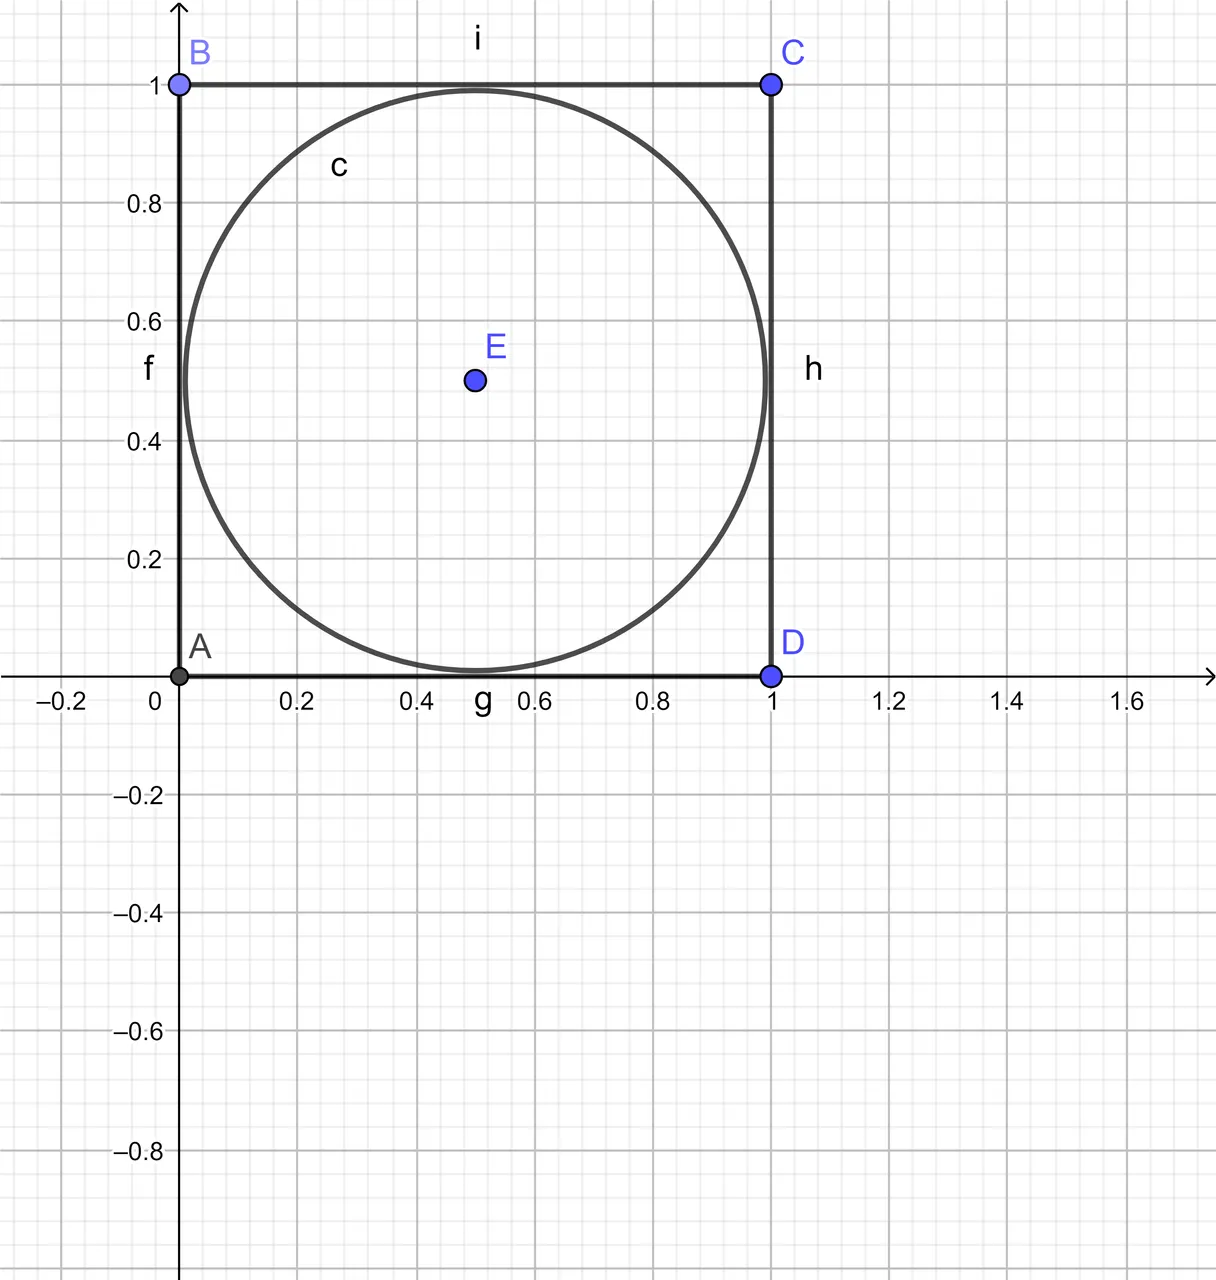
The ratio of the area of the circle over the area of the square turns out to be the same.

Sample R Code
I have featured some sample R code here for conducting the simulations and estimate for pi. This code can be modified for Python usage or for another programming language.
# Initalize some values

num_sim <- 100000
num_inside_circle <- 0
precision_dec <- 5


# In each iteration, simulate a random point in the 2 by 2 unit square with 2
# uniform random variables from -1 to 1

for (i in 1:num_sim){
  x <- runif(1, min = -1, max = +1)
  y <- runif(1, min = -1, max = +1)
  # Check if generated point is in unit circle:
  if (x^2 + y^2 <= 1){
    num_inside_circle <- num_inside_circle + 1
  }
}

# Compute Ratio of number of points in circle divided by number of simulated points
ratio <- num_inside_circle / num_sim

# Estimate of pi is four times the ratio.
pi_estimate <- round(4*ratio, precision_dec)

print(pi_estimate)