Maybe you've heard the saying that a picture is worth a thousand words, but guess what? Words themselves are pretty important also! Especially when it comes to visualizing data, putting labels on your graph helps the audience understand the story that your data is trying to tell. In today's post, we will explore how to use the labs command in the R programming language to add titles, subtitles, axis labels, and a variety of other textual information to graphs.
For purposes of this post, let's assume that we have already created a basic plot using the palmerpenguins data set. Note: If you're completely confused by what this code is doing, feel free to go back and check last week's post, where we cover the bare-bones basics of ggplot2.
#Starting Point
library(tidyverse)
library(palmerpenguins)


head(penguins)

ggplot(data = penguins,
       mapping = aes(x = bill_length_mm, y = bill_depth_mm))+
  geom_point(color = "blue", shape = 3, size = 2)
When we run that code, the basic structure of our plot looks something like this.

To start adding in some labels, all we have to do is use the plus sign and type the word labs like this.
ggplot(data = penguins,
       mapping = aes(x = bill_length_mm, y = bill_depth_mm))+
  geom_point(color = "blue", shape = 3, size = 2)+

  labs(

#the labels we will add will go in here

  )
The cool thing about this command is that the vast majority of textual information we want to include in the plot all live within a single labs function, and we can create titles, subtitles, and change axes all within this same command. Some of the options we can change include. The code below shows how to adjust the most commonly used labels; just replace what's between the quotations to customize the chart to your specific data.
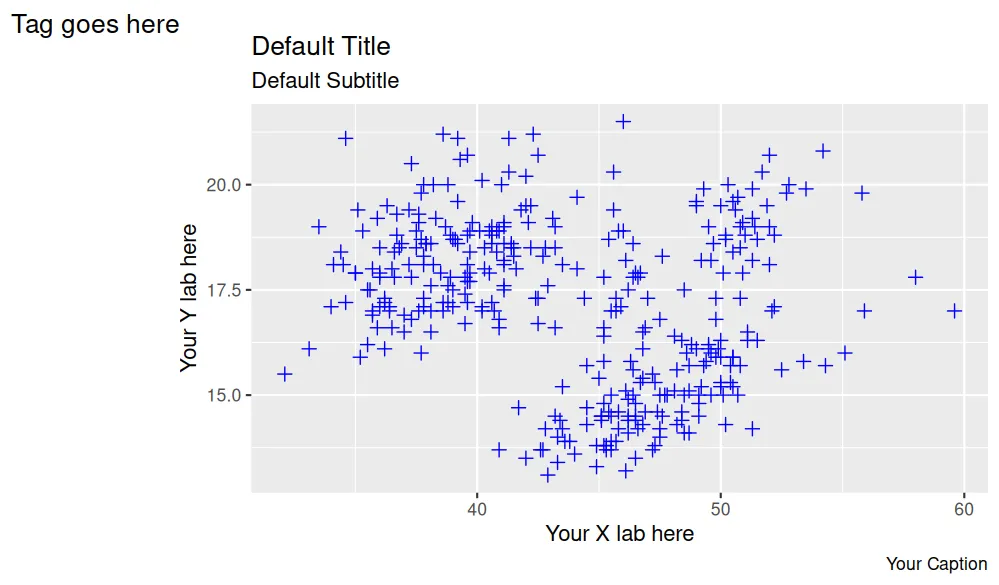
ggplot(data = penguins,
       mapping = aes(x = bill_length_mm, y = bill_depth_mm))+

  geom_point(color = "blue", shape = 3, size = 2)+

  labs(
    title = "Default Title",
    subtitle = "Default Subtitle",
    x = "Your X lab here",
    y = "Your Y lab here",
    caption = "Your Caption",
    alt = "Alt text",
    tag = "Tag goes here"
    )
Lastly, the chart below shows the default position of each element. It's possible to change the location of each element, the color, the font, and more… but that's the subject of another post.