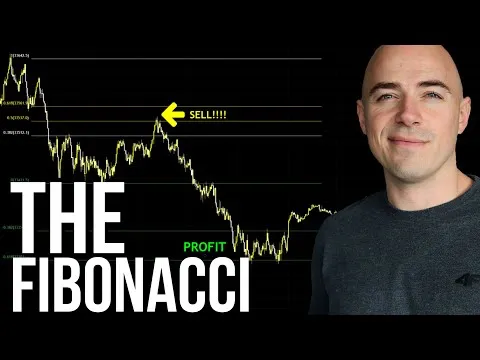
My mind is BLOWN today ... as I study the crypto markets and particularly Bitcoin, I find myself meeting the great fundamental levers of the universe!
Although it comes up in all kinds of day trading more often, Fibonacci retracement is used across all time scales of trading markets because in essence, a number sequence found all over the universe also leaves its footprints on human activities in markets. Just like you see the Golden Ratio in all kinds of designs, once you know how to look for it, you will see it EVERYWHERE. In a similar manner, many people in markets use similar understandings of ratios around Fibonacci sequences to figure out where any asset is likely to rise on the charts before stopping to consolidate and fall back, and how far it is likely to fall before bouncing and heading back up.
OK: so, already my mind was blown, but then I looked and saw how people are applying it to work through Bitcoin's price discovery in USD terms ... there's a whole invisible ladder up there ...
This video has a lot of information, but starts with explaining what price discovery mode: it’s all new territory above the all-time high. We have no ceiling any more once an all-time high is reached … but we do have Fibonacci levels, and with them, Mr. Aaron Dishner predicts that the last price mark to look for is $173K. Remember how Ben Cowen predicted a terminal price of $190K but said that it may fall a bit short? If he is right, $173K would fit for the top of the market. But that would also mean we are within $60K of the top. Life in crypto markets comes at us fast!
But how exactly will Bitcoin get up that $60K in the time predicted left in the cycle? Deep math, meet everyday physics ... bounce a ball in a narrow space, and what happens when it bounces out? That first bounce into a higher space is HUGE...
https://bitcoinist.com/bitcoin-180-day-compressed-3rd-time-cycle-next/
In the same way deep mathematics like the Fibonacci sequence and thus the golden ratio manifest themselves in the markets, physics has its representation too … in some consolidation patterns in which the asset is bouncing back and forth in price, the price range can get narrow, and when that happens, the bouncing becomes tighter until finally there is a burst out of the range with all that stored-up energy. So, in the last 180 days, Bitcoin’s consolidation ranges have become tighter and tighter … we had the big drop into the $75K range with a lower bounce out, and now it looks like the higher bounce out is setting up. Just getting to $110K is not it. 170K looks more like it.
But that also tells us this: altcoins may not have time to do all the stuff they are predicted to do ... this may be Bitcoin's cycle to outshine others even more than usual, and that is what deep math and even physics are telling us!

