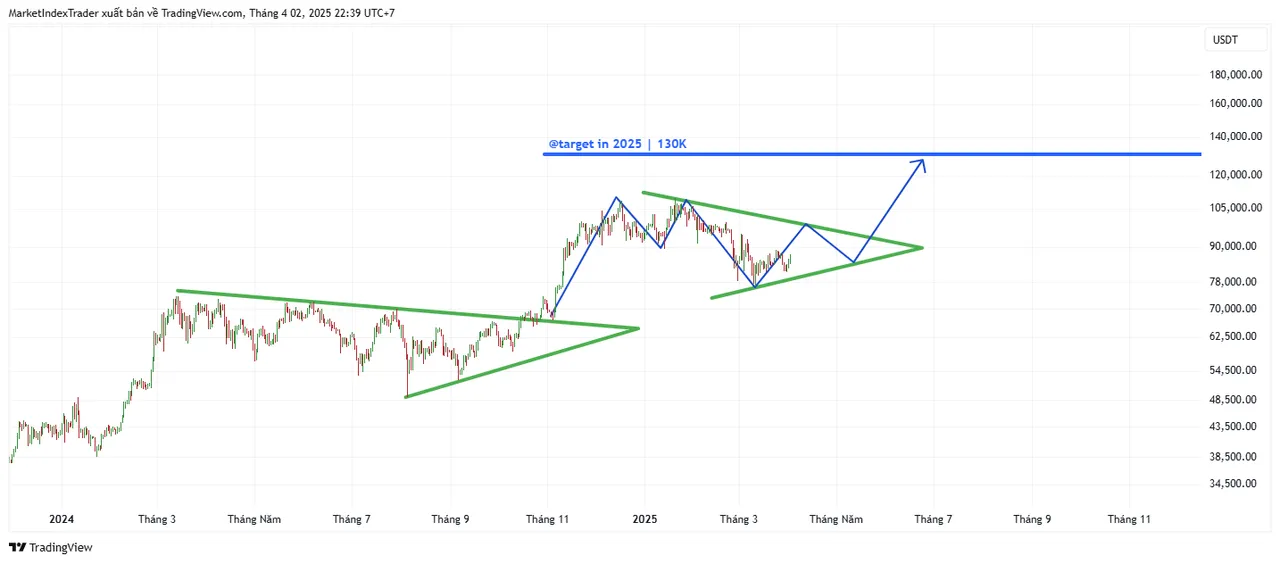
The price action forms an ascending triangle, a bullish continuation pattern often seen in uptrends. This pattern is characterized by a flat resistance line around $119,933.12 and an upward-sloping support line, indicating higher lows as buyers consistently step in at increasing levels.
Bitcoin has been consolidating within this triangle, with the price recently approaching the upper resistance.
A breakout above $119,933.12 would confirm the bullish pattern, signaling a continuation of the prior uptrend. The target for this breakout can be calculated by measuring the height of the triangle at its widest point and projecting it upward from the breakout level. This projection aligns with the $130,000 target indicated on the chart.
Additionally, the ascending triangle reflects strong buying pressure, as the higher lows suggest accumulation by investors. If Bitcoin breaks out with significant volume, the momentum could propel it toward the projected target.
However, traders should remain cautious of false breakouts and monitor key support levels within the triangle for confirmation of the trend.