Well, it's now been right at a year with my Solar and Battery Backup system. Some interesting stats. It's producing about as expected, but not as much as I hoped. My vendor (Enphase) added some useful charting info called "Solar Offset" to their web interface. I know I asked for this several times and I'm sure others did too. It now provides a chart of the solar vs. grid power used so that it's easy to see how much of a percentage your Solar farm is producing compared to grid utilization. This was not previously calculated accurately by them as you can see from the other chart labeled "Energy Independence". I love this new Solar Offset chart addition, and kudo's to the Enphase team for adding it.
I decided to go back and get the stats for the last 12 months to see how it is performing in the various months here in Mid Florida. Here is the Link to the original install post last year with better drone pics.was so worth it last year when the neighborhood without power for 4-5 days.
Let's start with overall stats for the entire past year.

This shows that our overall Solar production for the past year offset our grid power bill by 62% for the year. We produced 17.5 Mwh and Consumed 28.2 Mwh. Yes, we are high consumption users. Keep in mind that we not only run the AC a lot for health issues, but we also both work from home that includes cooling our 3 car garage space that is taken up by my partner's large quilting machine and embroidery machine (that also adds to the power drain). And I also charge my Chevy Blazer EV which accounts for at least a third of the electric bill depending on driving. One day I may figure how to separate the two costs.
The way my panels are situated on the roof, they don't get into full production until about noon. They get some partial power starting at 8am. My goal would be to add another 8 to 12 panels that can catch more morning sun to extend the production hours and also increase the production to fully offset the grid usage and keep feeding back to the grid. We are able to do that already a few months of the year, as you'll see in the details, but I'd like to extend that more.
Basics of system are I have 32 panels, 4 battery backup units, the main gateway controller and brain of the system, and individual microinverters on each panel/battery. The system is super smart, able to switch from grid to battery in a microsecond without us even noticing the outage in the several small outages we've had around 10-15 minutes. We get about 3 days/nights of usage off the batteries in the event of an extended outage if we're not using the Air Conditioning (see previous post here), and basically unlimited if we get at least some partial sun on those days to recharge the batteries and run the house.

Here are the 32 Panels, facing mostly west due to roof position. I would like to add 12 more to the other side(s) to pull in more morning power and increase overall power.

Here is the 4 batteries on the bottom, the smart controllers above.
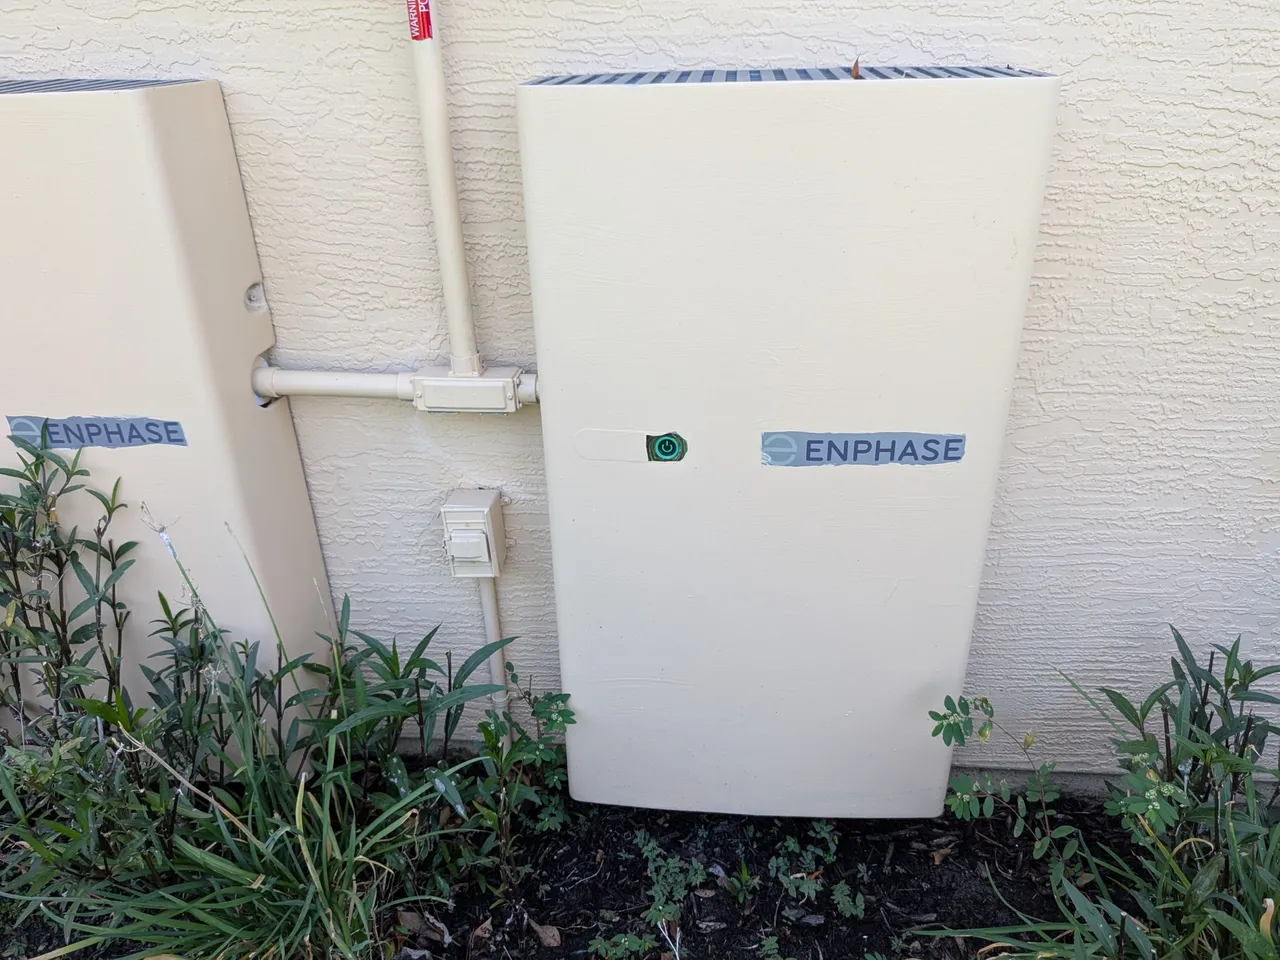
A closer view of the Enphase 5P battery.

Here you can see the power connection. The grid power comes from the ground (buried) then into the meter. It then goes into a breaker box, then to the smart controller. The power then comes out of the smart controller and feeds back into the main house breaker box from the conduit you see at the top feeding back into the house. This way our entire house is on the Solar/Battery controller and all plugs and devices are able to be used. We then control power usage ourselves by turning things on or off. This has a slight drawback of possibly using excess power if away and grid is lost, but even with the AC and everything else running, we'll still get a full night and maybe a full day of power, much more if we turn off the high energy devices.

Tech Details of the system:
System Size = 13.44 kW DC
Panels = QTron M-G2+420 (32 Panels, 420 Watts each)
Micro Inverters = IQ8M-72-2 (240V)
AC rated power output = 10.56 kWh AC
Estimated First Year Production
17,914 kWh
Battery Backup = Enphase 20.16 kWh system (4 IQ Battery 5P)
Battery capacity = 20.2 kWh (5 kWh each)
Operating power = 7.68 kW
Monthly Breakdown of Solar Offset:
July 2024 - 56% Offset - 1.1 MWh produced, 1.9 MWh Consumed. (half month installed on 7/12).

August 2024 - 52% Offset - 1.6 MWh produced, 3.1 MWh Consumed.

September 2024 - 46% Offset - 1.2 MWh produced, 2.7 MWh consumed.

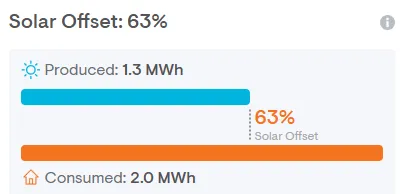
October 2024 - 63% Offset - 1.3 MWh produced, 2.0 MWh consumed.
November 2024 - 59% Offset - 1.1 MWh produced, 1.8 MWh consumed.

December 2024 - 51% Offset - 883.7 kWh produced, 1.7 MWh consumed.

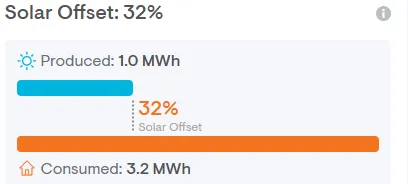
January 2025 - 32% Offset - 1.0 MWh produced, 3.2 MWh consumed.
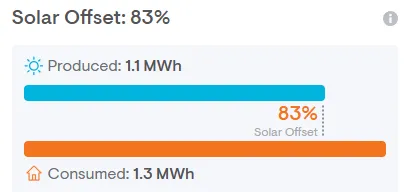
February 2025 - 83% Offset - 1.1 MWh produced, 1.3 MWh consumed.
March 2025 - 129% Offset - 1.7 MWh produced, 1.3 MWh consumed.

April 2025 - 109% Offset - 2.1 MWh produced, 1.9 MWh consumed.

May 2025 - 72% Offset - 1.8 MWh produced, 2.5 MWh consumed.

June 2025 - 60% Offset - 1.7 MWh produced, 2.9 MWh consumed.

July 2025 - 54% Offset - 1.0 MWh produced, 1.9 MWh consumed (partial month 20 days)

Keep in mind that our primary motivation for Solar was to provide power backup during the frequent outages and hurricanes we have here. On that front, we are extremely happy with the system. It has been fantastic to go thru these small outages without even notice (unless I look at the logs and alerts), and was so worth it last year when the neighborhood without power for 4-5 days.
Our payments are about $230 per month, and according to the stats, it saved us about $219 per month on our elec bill. Yes, some months our normal bill would be less, but also sometimes our monthly bill was over $500, so it's almost paying for itself. I think adding the 12 panels would put us over the top, but need some additional capital funds to work with first. Adding panels is a fraction of the initial install cost though, but prefer to wait and pay cash so they can immediately start adding value rather than another payment.
Other cool charts: Keep in mind that our cold months are Jan-Feb and our Hottest months are July-Aug. Our home is (almost) all-electric except for the Pool Heater which is propane (but electric pump). We actually over-produced 2 months March-April and got some credits on our bill the month following. Was so nice to have a $0 electric bill for that month, now if I can multiply that by 6 or 8 would be ideal!
Produced vs. Consumed Chart

Solar Offset Chart:

Electric Bill Chart:

Table of Solar data:

Now before you freak out and judge me over what you may think are high electric bills, remember that I also drive a Blazer EV. So ALL my driving costs are also included and we had a lot of driving back and forth to Mayo clinic every week last year. About $500-$1000 of the $2,300 total annual electric bill was from charging the SUV.
I like this so much better than the propane generator backups we had in the past. Those would always cause internet disruption during the powerup/powerdown transitions, were obnoxiously noisy, and of course did not provide any money back for the investment other than the convenience of having power during outage. All the maintenance and fuel costs were just another addition.