I waited to achieve the ZING goal for this post, to have two-in-one.
ZING Goal Achieved. New Goal Added.
This may have been a pretty difficult goal when I set it at the beginning of the year, but in the meantime I purchased some Alpha Vials and the collection rewards associated with them made the goal much easier.
So... here we are:
200k ZING staked
After completing this one, since the game play isn't launched yet, and I still want to focus on Holozing, I've had two options:
- set a higher goal for staked ZING, in line with my current rewards
- set a different goal for the remaining of the year, that involves Holozing and the rewards I earn there
I chose option 2. I am fine with 200k staked ZING, and want to keep it like that for now. My new goal is to have 50k ZING in the SWAP.HIVE-ZING, by the end of the year (or sooner). That also means another ~50k of ZING-worth of SWAP.HIVE.
Update to Hive Portfolio Charter
Since Monday, I slowly got back to improving the charter, but most of the work I did yesterday.
Modularizing Javascript
The bulk of it isn't as exciting, as it represents another round of preparing the code for future scaling up, by modularizing the existing js file, which started to grow to a respectable size.
For those interested in some details, I carved out the dashboard logic into an extended class, now found in its own file. It is also the new entry point into the Javascript code, the one loaded in the HTML. Helper functions were also moved to their own file and imported where needed.
There was a bit of work here, because it's not as simple as copy-pasting portions of code from one file to another. We are talking about two different programming paradigms (object-oriented and function-based) that needed to blend well together or the code wouldn't work. Of course, I could have re-written everything using only one paradigm, but the effort wasn't justified... for now. Plus, it helps me get re-acquainted with a vaster range of the programming spectrum.
Note that if by any chance you ran this tool locally by loading the
index.htmlfile directly into the browser, it won't work anymore. You'd need to serve it via a web server to localhost (which can be much simpler than it sounds). If you want no complications, just use this link.
Loading JSON Files from Multiple Locations
So... we had support for multiple accounts, but due to the directory structure, loading snapshots from multiple accounts was... not easy.
The file picker only allows you to select multiple files from one directory, and we couldn't change that, nor we wanted it, most likely.
Luckily... the solution was pretty simple. Instead of loading a fresh set of snapshots every time we choose the JSONs to load, why not combine them instead? Meaning add to the existing set of loaded snapshots and remove duplicates.
Of course, this solution made it necessary to exist a "Clear Data" button too, which mainly "unloads" loaded snapshots and other related variables from memory, and resets UI elements to defaults.
A visual representation is much better:
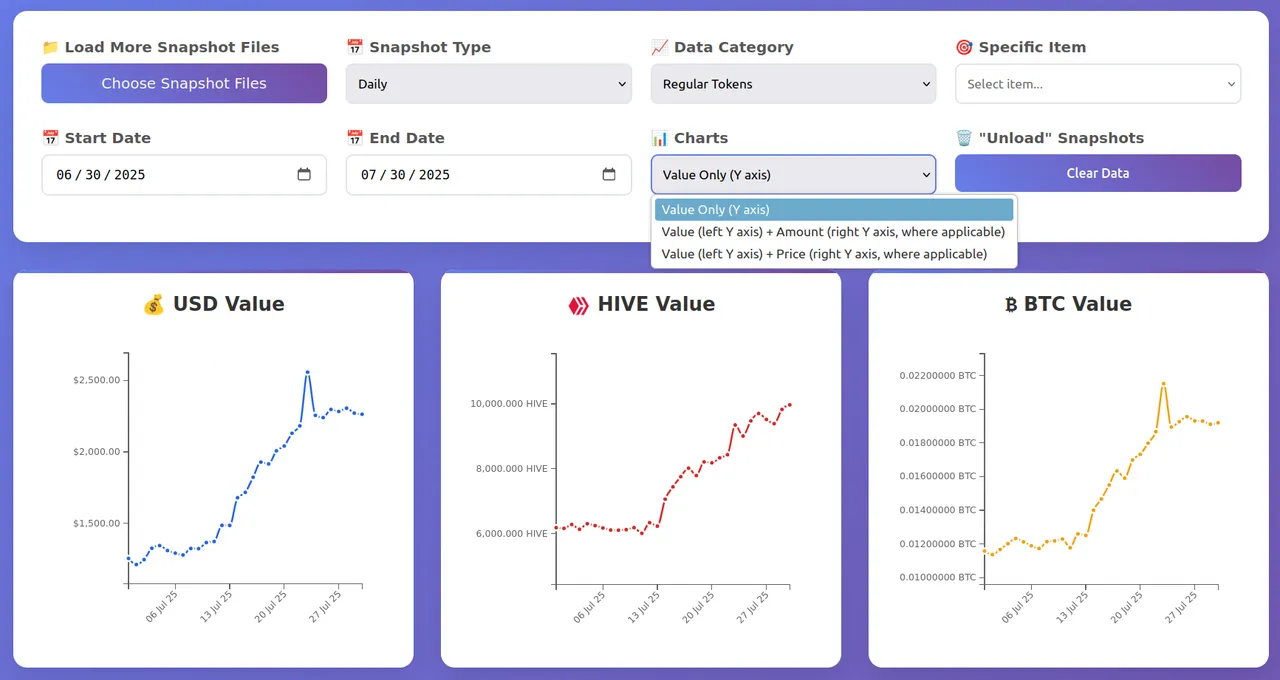
See the "Clear Data" button at the left-bottom corner of the user-settings area?
Minor Fixes and Immediate Plans
I also fixed an issue with the info message regarding unrealistic price drop filtering persisting after option changes, when it should have been cleared. Initially, I thought it was the filtering itself which persisted, and that made me lose some time chasing wild geese.
A minor QoL enhancement was that the radius of data points is now automatically determined based on the number of data points we show. A lower radius for more data points, with 5 levels, which I may tweak further in the future as I see how things look with more data.
You may see in the image above the "Charts" dropdown. This is for now only added to the UI, there is no back-end logic associated to it. But I guess you can see where that is going...
I want to show on the right Y axis, either the amount (for tokens or diesel pools), or price (for tokens), if those options are selected. That is needed because sometimes a drop or a spike on the value chart is nothing more than selling or buying some of the asset being displayed (or moving from a different account), and not a variation of price.