Among Peers
This is a series of fourth post I did on land efficiency at Praetoria for Splinterlands. The goal of these posts are multiple
- Look for overall inefficiency in Land utilization, and fix them
- Motivate people to improve their land game
- Compare yourself with others, and see how can you improve
- Compare yourself with peers, meaning people with similar assets and investments
The goal of this post is to find your own place in this universe and see if you can make it slightly better.
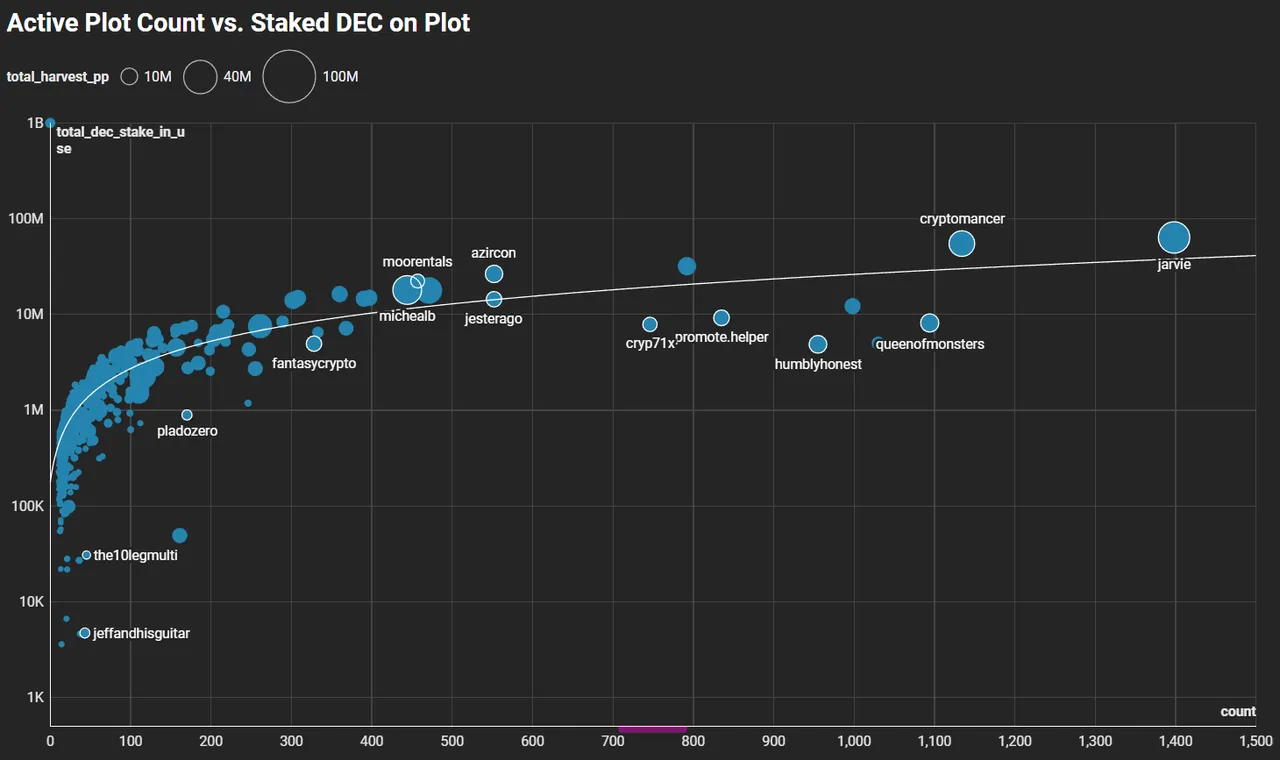
This is a simple plot of number of active plots people hold, with the active staked DEC they have to farm these plots. The circle size is proportional to the boosted PP of the cards they have staked on land. This plot is easy to understand, and visually pleasing. I will use this to slide along and find your peers.
There are only 12 people with 500+ plots active. Here are their statistics.
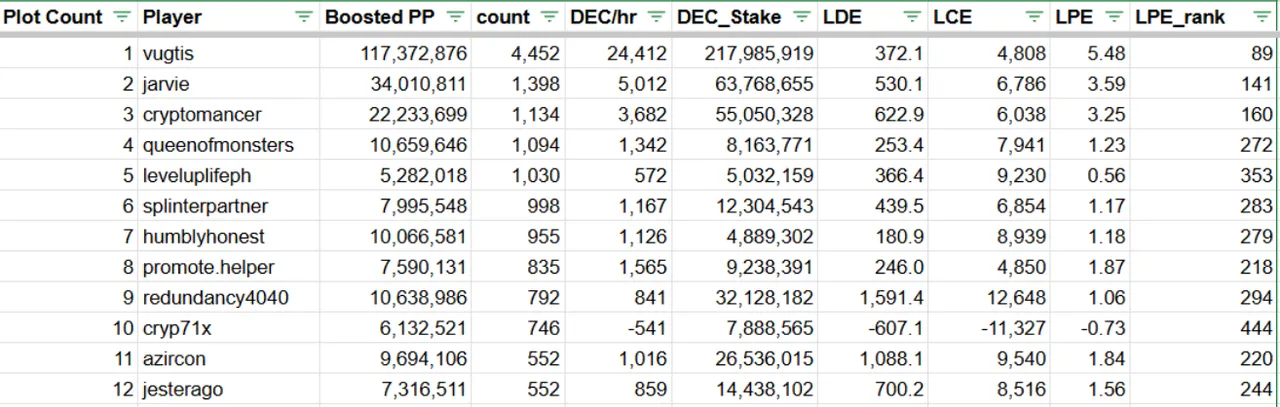
I have already talked about most of these individuals, so I am not going to discuss this table. We will move on to the next group of peers.

People with 100 to 500 Active Plots
There are 63 accounts in this category. No they are not all peers. Since their distribution and asset ownership are variable, their efficiency is also highly variable. The best fit curve is a cubic equation. It is used just as a reference. Above the curve means, you are deploying more DEC compared to your peers, below the curve means you are deploying less, but getting the same earning. We will test this with further plots.
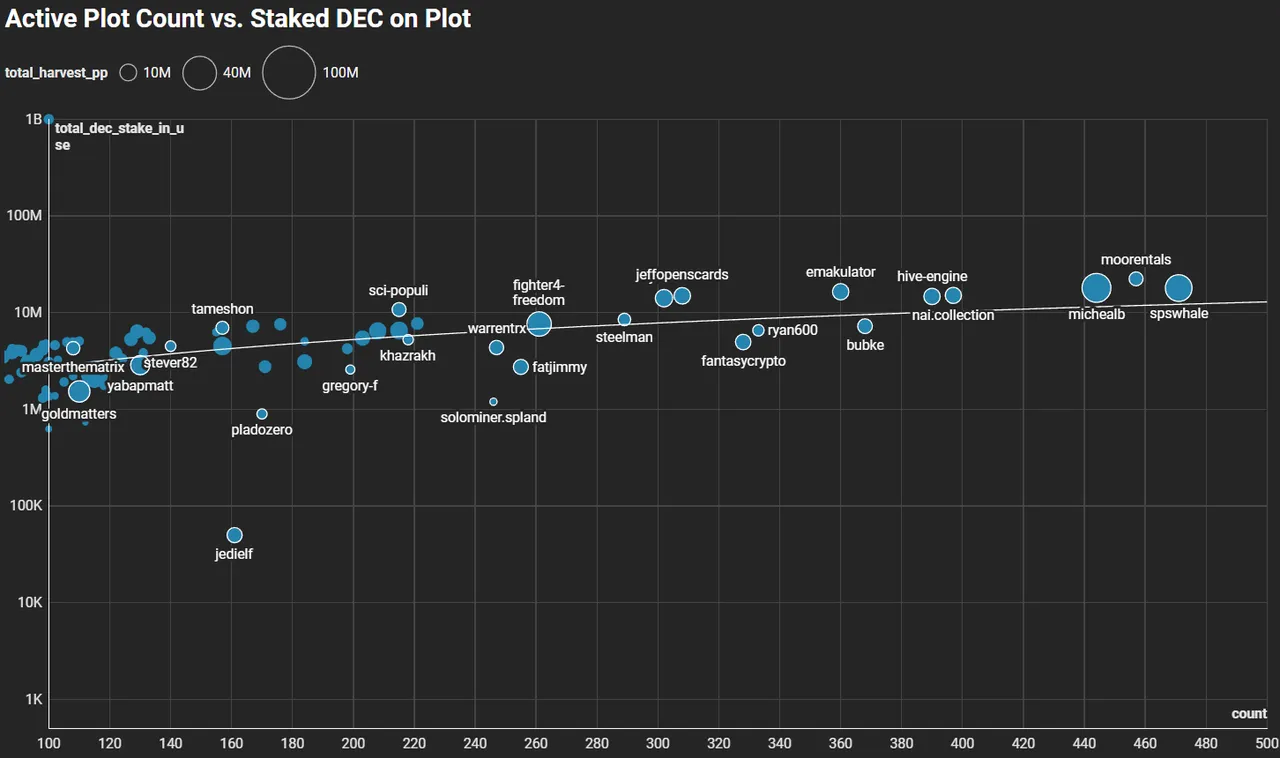
Here is a good group of peers, they are very close to 100 active plots, so they don't show up well. However, if you take a glance at the table, you can see they virtually have the same number of plots.
| Player | Boosted PP | Count | DEC/hr | DEC_Stake | LDE | LCE | LPE |
|---|---|---|---|---|---|---|---|
| slobberchops | 1,219,975 | 103 | 135 | 3,292,859 | 1,019.3 | 9,063 | 1.31 |
| kauffdiggity | 1,842,645 | 103 | -401 | 2,836,201 | -294.4 | -4,590 | -3.90 |
| ajpl | 2,335,075 | 102 | 281 | 4,650,000 | 689.7 | 8,312 | 2.75 |
- first, they are very different DEC/hr, kauffdiggity is deeply negative
- @ajpl is more efficient than @slobberchops, reflected in higher LPE and lower LDE for ajpl
- that said ajpl does require more DEC that slobberchops
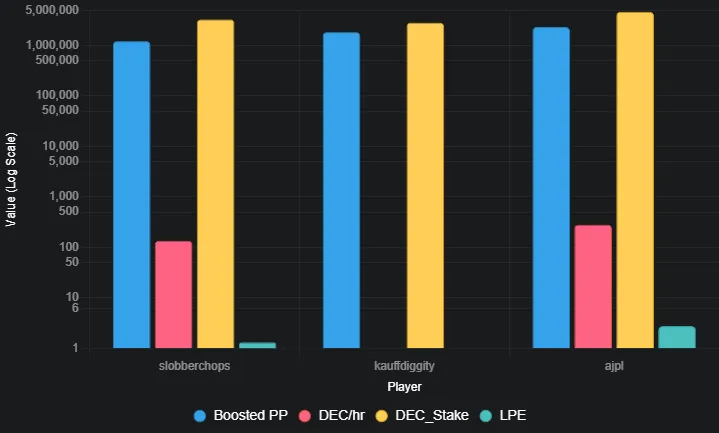
I didn't plot the negative data, it simply looks bad :)
People with 50 to 100 Active Plots
There are 80 people in this group. I had the change the scale for visibility of the scatter, so it might seem wider, but it is not. The clustering is similar to the previous group.
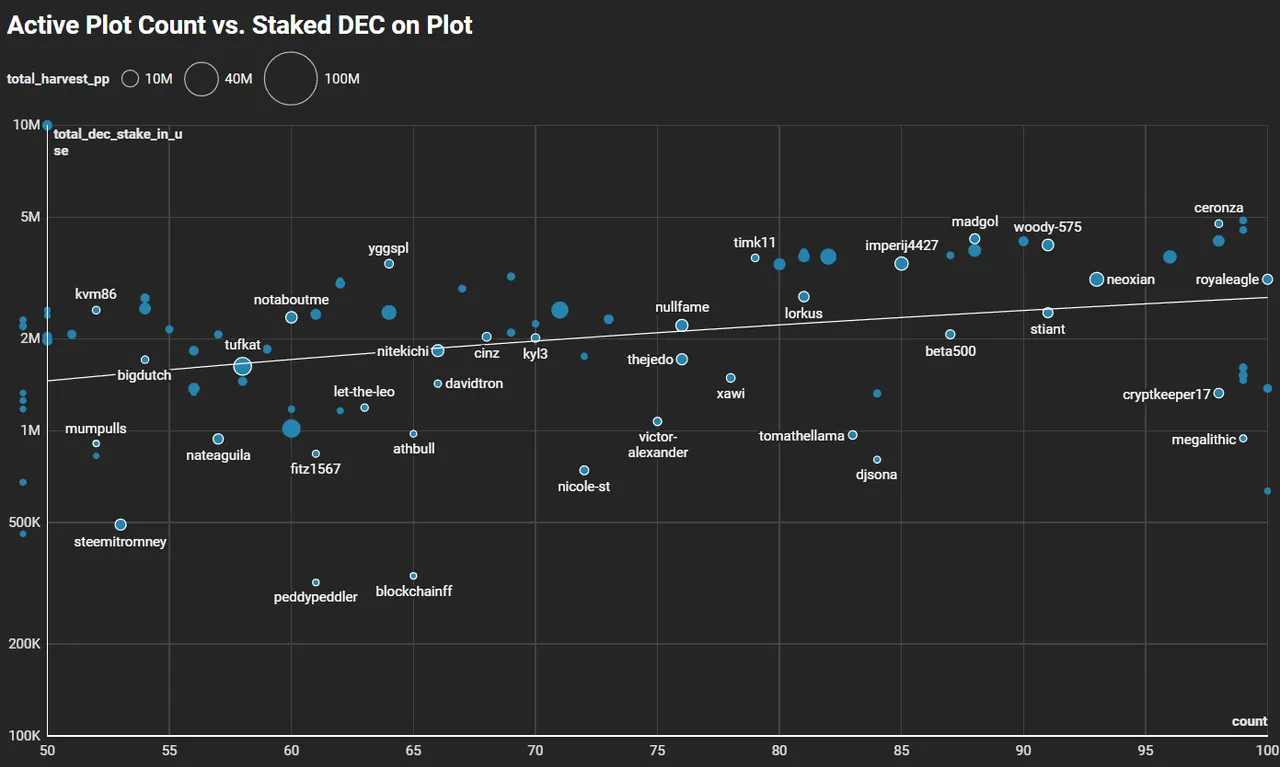
Again, we can test a small sample so that you can see all the ratios closely.
| Player | Boosted PP | Count | DEC/hr | DEC_Stake | LDE | LCE | LPE |
|---|---|---|---|---|---|---|---|
| xawi | 1,429,057 | 78 | 131 | 1,487,986 | 474.9 | 10,946 | 1.67 |
| thejedo | 3,165,604 | 76 | 579 | 1,713,245 | 123.3 | 5,468 | 7.62 |
| nullfame | 4,085,193 | 76 | 119 | 2,209,920 | 772.6 | 34,277 | 1.57 |
These three folks have very similar plots, but look at my boy @thejedo !
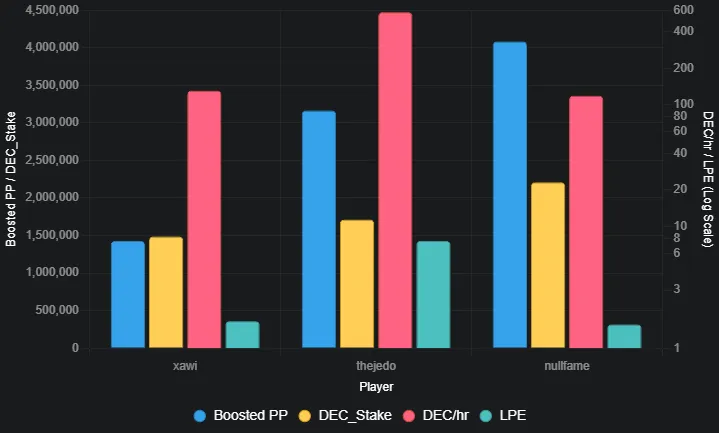
Best LPE in his class! 5X compared to his peers! Now, that is what I call excellent!
Finally, the group 1 to 50 Plots
This is a difficult area to plot, because of data density. However, a lot of my close friends are here. I have displayed many of their names. 2301 account falls in this category. So peer analysis must require deeper dive.
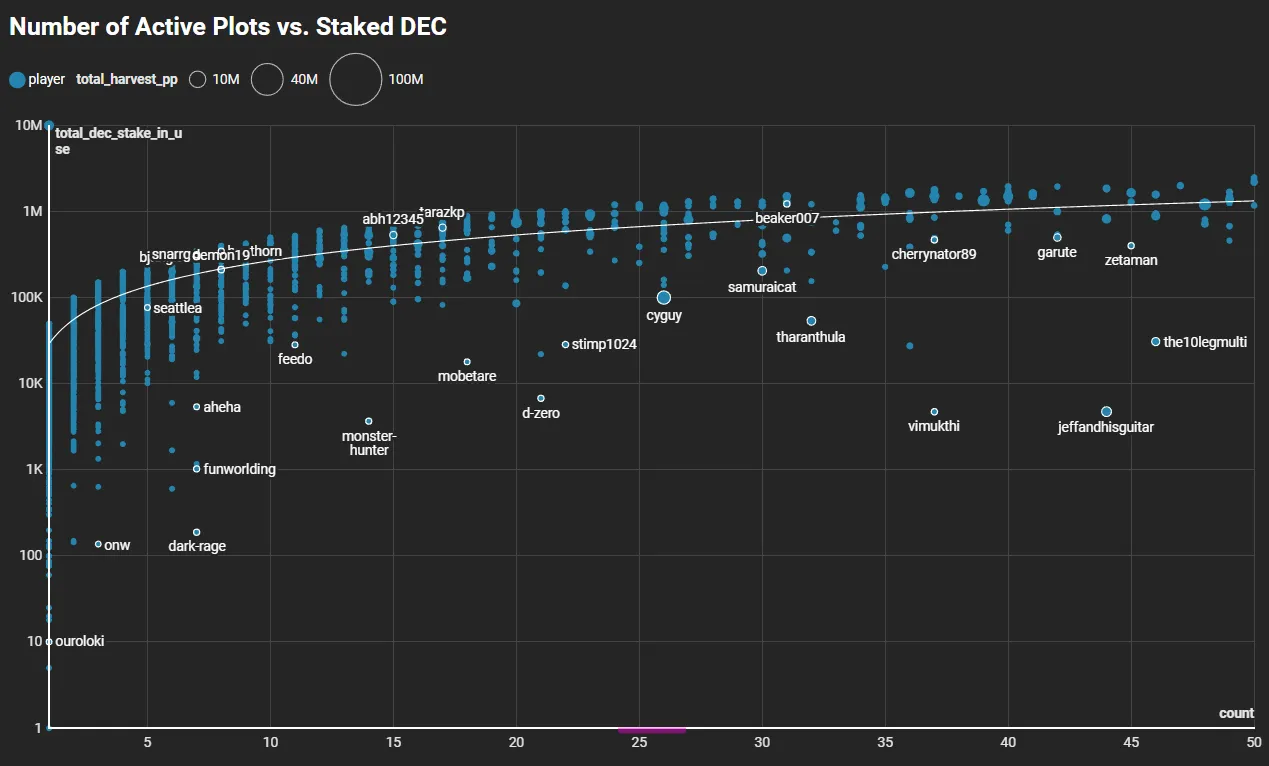
There are a lot of inefficient accounts in this space, and I have to think about how best to plot this area in more details. That will be my task for this weekend. Important thing at first glance is to look at the range of DEC staked. At 5 plots group, please have staked 10K DEC to 150K DEC! That is a 15X range. So the results of earning must be highly variable.