Introduction
Just released an new version of the splinterlands statistics v0.4.0. In this a new feature I'm proud to announce there is an historical overview added in the portfolio page.
Because of the no bots in modern I want to know my win rate and my bots win rate in wild.
Therefore I implemented an somewhat unplanned feature monitor battle statis on daily basis.
Previous posts:
v0.3.1 - Add generate hive blog
v0.2.0 - Add filter and sort options to home page
v0.1.0 - First implementation Splinterlands Statistics V2
Last "Old" Splinterstats tool V1
Main features of this splinterlands statistics tools are:
- Capture battle history Win and Loss matched
- What are your best cards
- What are the cards you lose the most against.
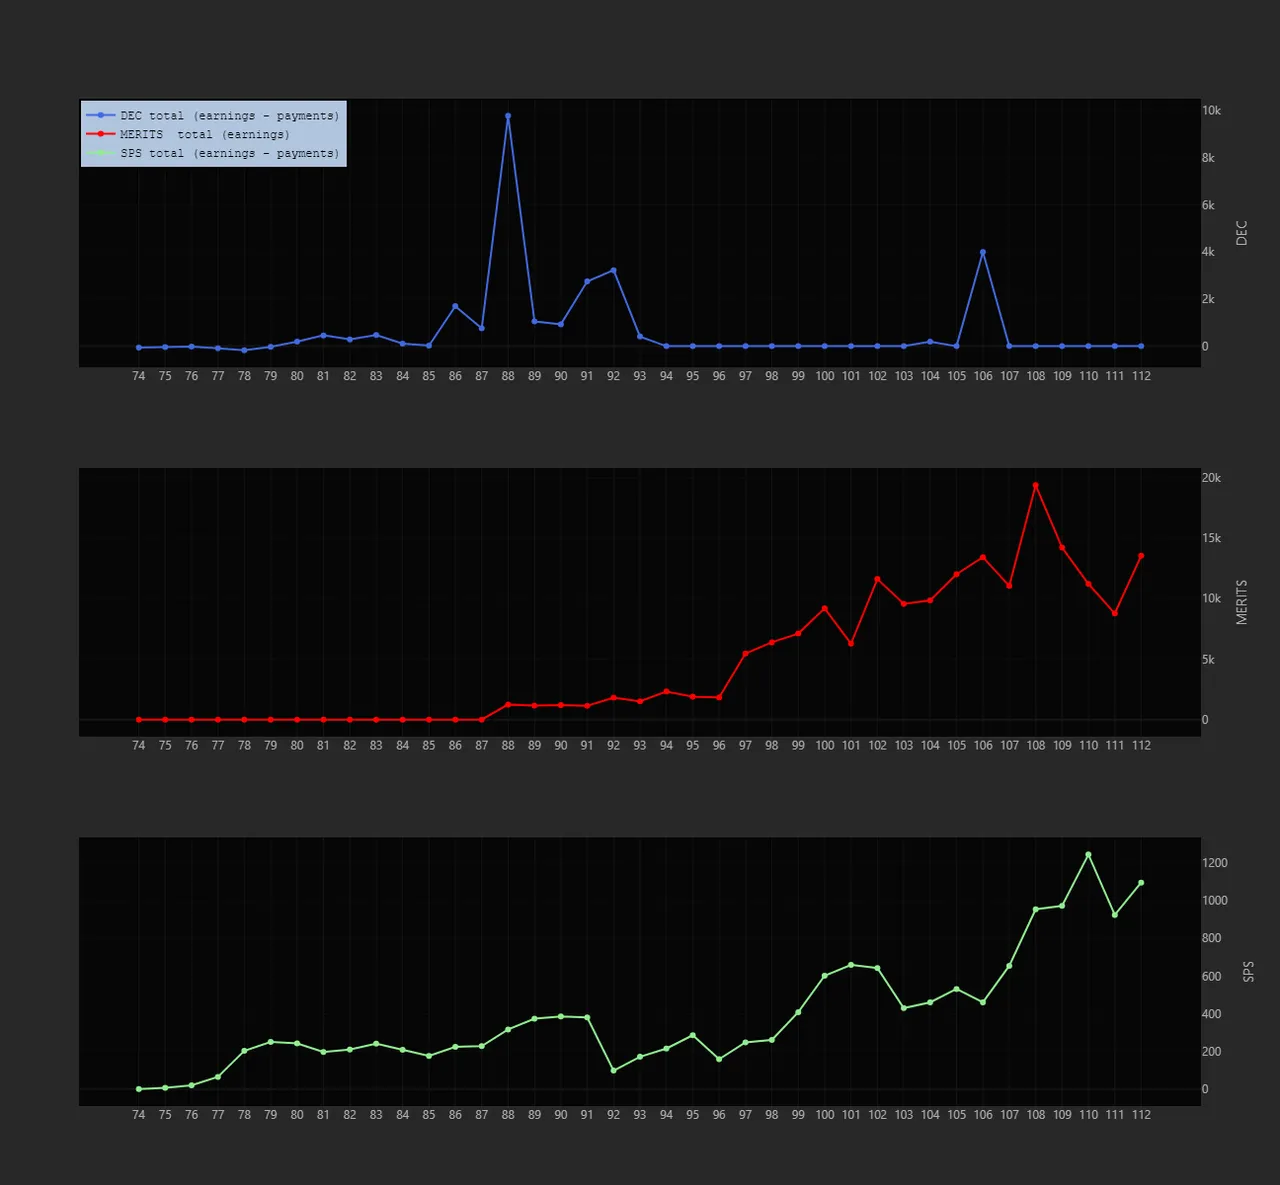
- Tracking your season results in playing and earnings
- Generate hive blog of last season
- Tracking your portfolio, investment and value
View categories, CARDS/SPS/DEC/.. etc, at an certain time in history
- Your nemesis (fun statistic)
- Rating over time
View battle stats per day. Daily win rate modern and wild
What is new...
- Remove previous migrations
- Migrate battle data, add modern or wild format and re-add Zyriel secondary color.
⚠️ Note that this might take a long time if you have logged already many battles. All battles need to re-processed again. - Use Dash clipboard functionality i.s.o. pyperclip, remove pyperclip dependency
- Update git repository link in hive blog to the new tool
- Add daily battle graph
- Make portfolio graph clickable to give detail overview of categories
Lets elaborate a bit on the new features

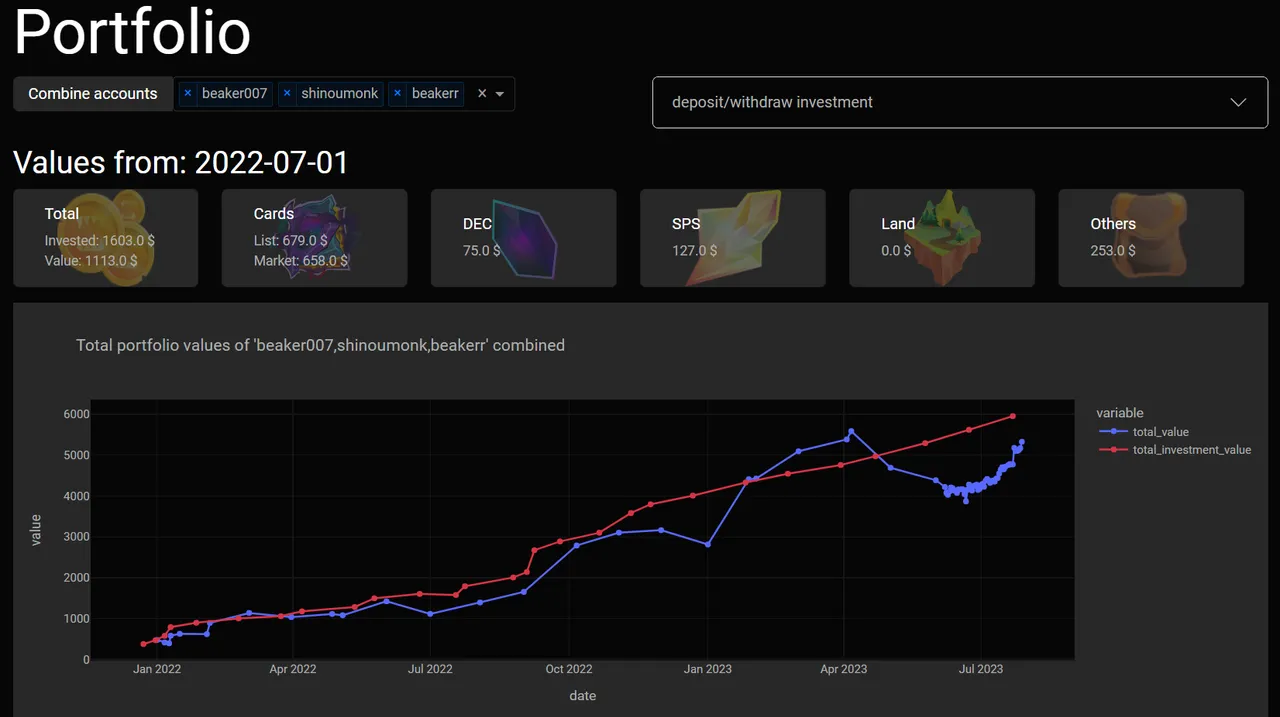
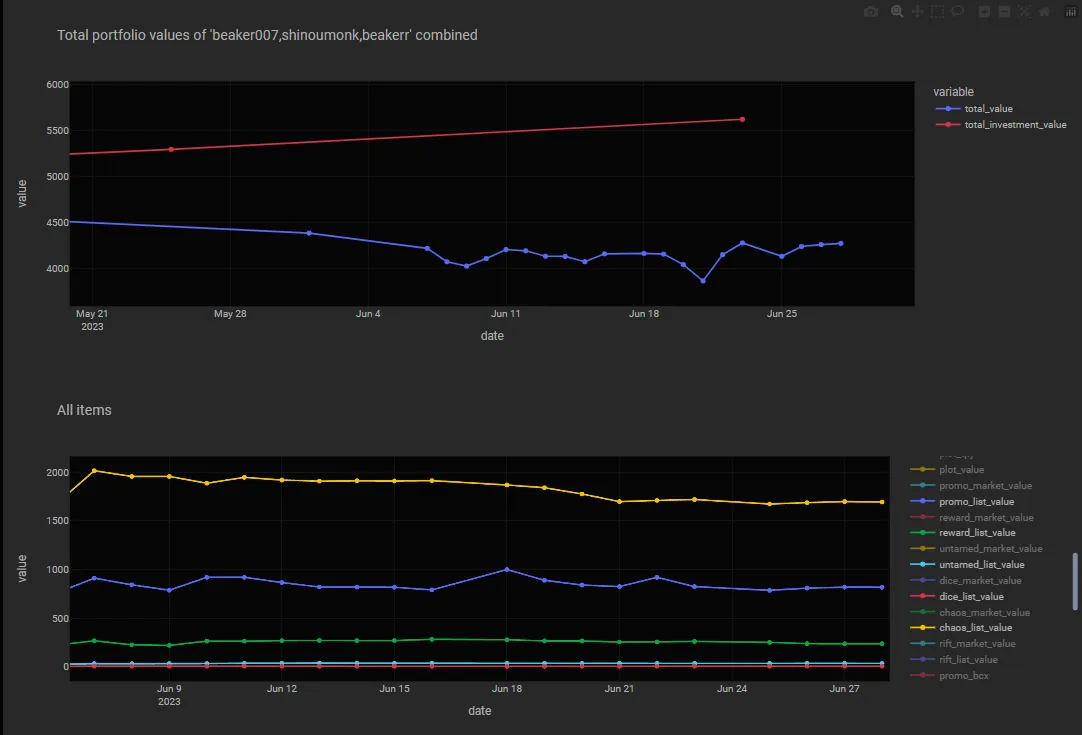
View historical categories
First you will notice there are now categories on the top of the chart.
- Categories
- Total investment value and value
- Cards, all card editions summarized value market value and list value
- DEC, value of all in game DEC.
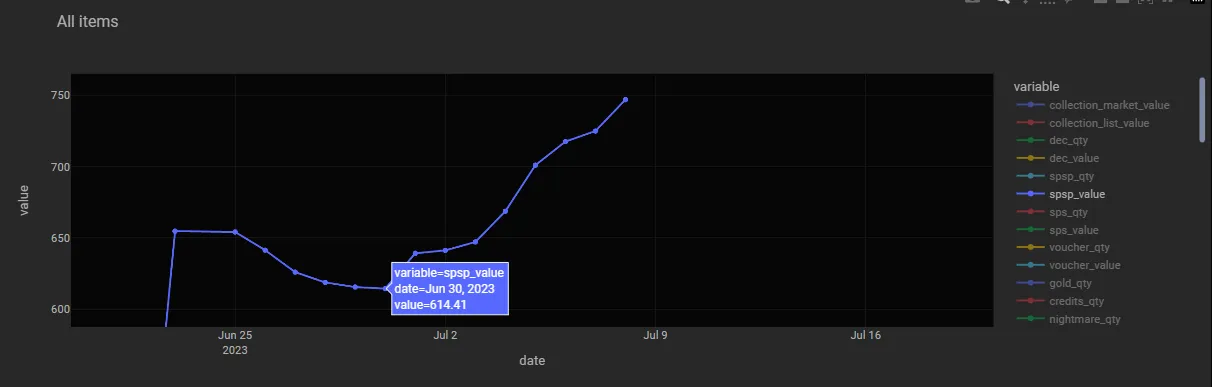
- SPS, value of all in game SPS including the staked SPS.
- Land, values of plot/deed/totems summarized
- Other, all other values stuff like
- DEC:SPS liquidity pool
- Packs e.g. chaos nightmare
- License
- Vouchers

Now it is also possible to select an date in the past and see the categories at that moment.
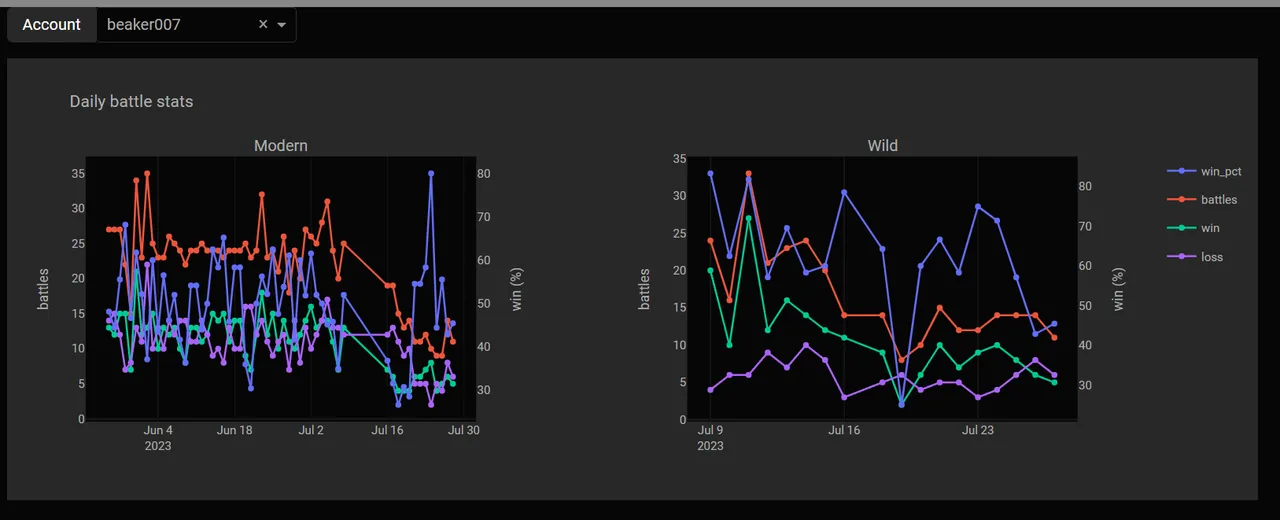
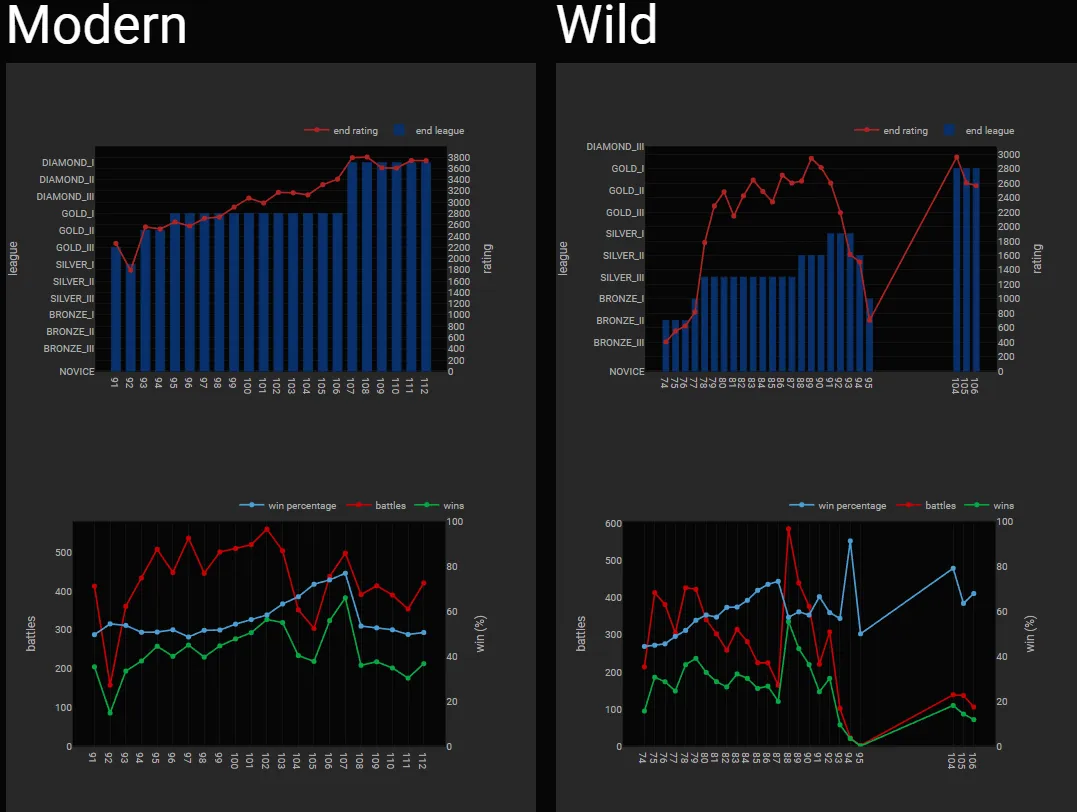
Add daily battle graph
This was not a planned feature now with modern no bots allowed I wanted to know what my battle win rate is again the bot win rate in wild. I could wait one season an monitor it per season but i wanted to view it on daily level. I already capture the data so "only" a view needs to be created.
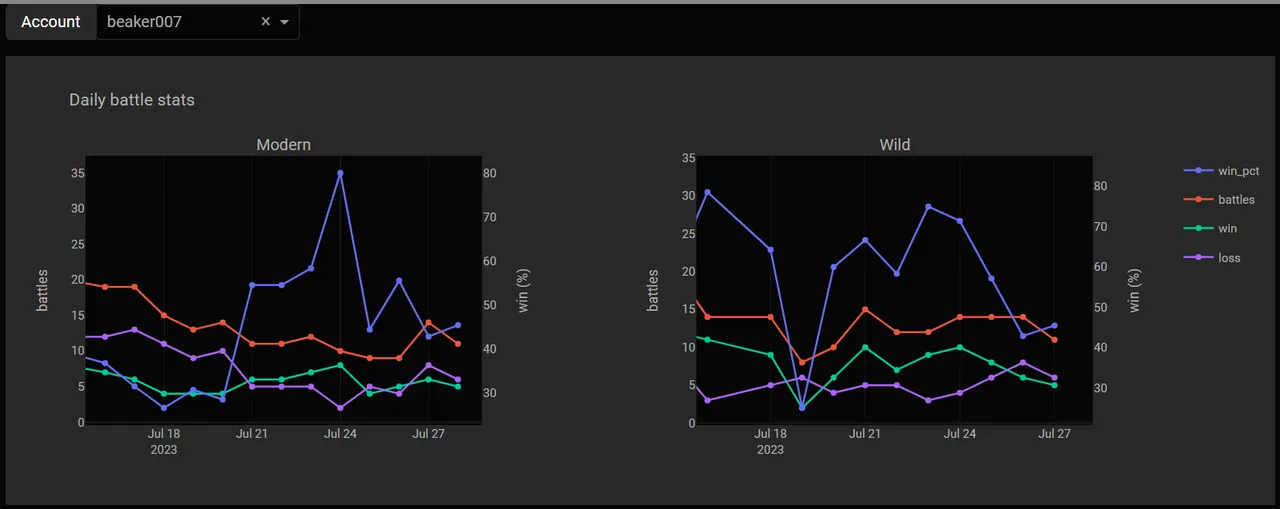
And also here again you can zoom in a certain period like since 16-Juli in this example:
Unfortunately for now I must conclude the bot has overall an higher win rate. still I think the earning in modern is better for now. And the most important thing is i like playing my own battles.
Showcase some other features...
Tracking your complete portfolio value and view how your editions are valued:
View you staked SPS value over time and zoom in:
Summarized seasonal earning:
Seasonal battle statistics:
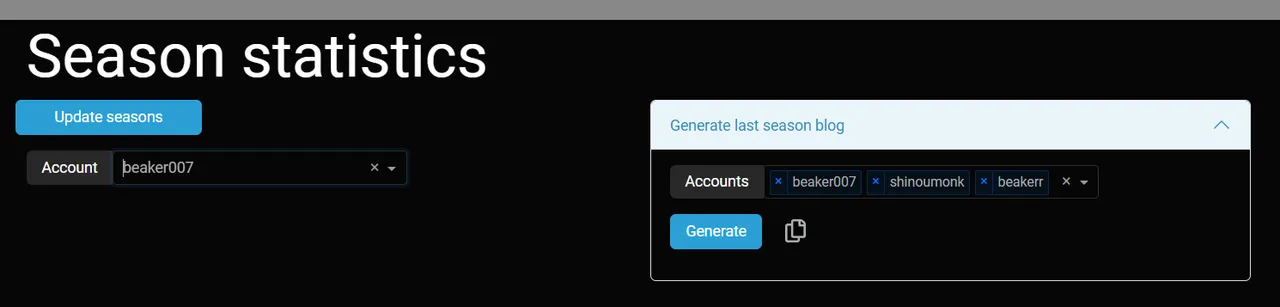
Generate hive blog post about you last season:
What is next...
Continue update portfolio page:
- separate values and quantities
- add tracking of card edition values/bcx/number of cards.
make main chart selectable display widgets with:carddecsps / staked spslandothers
Future updates ideas:
- Update season page, also separate value and quantities
- Create specific card page with detail battle history for a single card you own
How to use splinterlands statistics
⚠️When this tool is used for the first time and you are collecting seasonal data it has to retrieve all historical data, this can take a very long time, depnding on how long you have played the game and how many transaction are done. Especially when a renting bot is used it probably has many small DEC transaction.
With windows executable
- Download windows executable Download exe
- Unzip
- Run main.exe
- Browse to http://127.0.0.1:8085
- In the config tab add the accounts you want to monitor
With linux executable
- Download linux executable Download tar
- Unzip
- ./main.sh
- Browse to http://127.0.0.1:8085
- In the config tab add the accounts you want to monitor
With Docker
docker login ghcr.io --username your_github_username

docker pull ghcr.io/gamerbeaker007/splinterlands-stats-v2:latest
Windows (docker):
docker run -p 8050:8050 -e "HOST=0.0.0.0" -it -v C:\Temp:/app/store ghcr.io/gamerbeaker007/splinterlands-stats-v2:latest
Linux (docker):
docker run -p 8050:8050 -e "HOST=0.0.0.0" -it -v \tmp:/app/store ghcr.io/gamerbeaker007/splinterlands-stats-v2:latest
With python development or local execution
Download source and unpack, source link.
Use python 3.8 or higher.
pip install -r requirements.txt

python src/main.py
When installing on a window machine and encounter this error message:
scrypt-1.2.1/libcperciva/crypto/crypto_aes.c(6): fatal error C1083: Cannot open include file: 'openssl/aes.h': No such file or directory
Then install Win64 OpenSSL (not the light version)
Disclaimer
This is an hobby project that I do in my spare time.
Why:
- I love to dive into data for a game I love to play. In the future hope to see nice improvements in my playstyle because of the data analysis.
- Secondly practice my programming skills and keep it up to date.
In the future I will try to migrate data with newer updates but expect that sometimes you got to start over with collecting data, I cannot/will not make any promises. I just add stuff I like to view and hope others can appreciate it.
Big caveat, not sure yet how it will perform with large datasets.
Everybody can start using this, since it is a new project expect some crashes or things that are not working for your situation.
As normal when you run into problems send me a message and I will try to help solving the issue.
Any suggestions/remarks/improvements or bugs please leave a comment or send me an message
That's all for this week hope you enjoyed reading and all start tracking data to get more insights.
See you all on the battlefield.

Not a splinterlands player yet, consider using my refferal link.