
WEN LAND?
Wen Land, the players of Splinterlands cried for an eternity. With the advent of the White Paper; a whole bunch of people started to realise that they needed to obtain a lot more cards. Others, with large collections, looked to their palms, often placed right in front of their eyes, at the monumental task in front of them.
I've got an easier way for you to suffer. This script will save you a whole bunch of time in the future, until someone builds a web app that can do this automatically. That person won't be me, unless someone pays me a gratuitous amount of SPS or DEC to do so.
Things you'll need to use my method:
- A Python Interpreter
- Google Sheets or Excel
- PeakMonsters
- A Web Browser
- A Fresh Directory on your PC
ONE
Create a new directory on your computer and call it "holoz0r is awesome"
TWO
Reflect upon the majesty of the beard that holoz0r brings to Splinterlands.TV, the Roaring Twenties, and indeed Splinterlands.
THREE
Choose how you're going to use Python. I use pyCharm, because it is free, and has a lot of advanced features. It is also cross platform.
FOUR
Install pyCharm or whatever Python interpreter you want to use.
FIVE
Point it to your "holoz0r is awesome" directory for you first project.
Optional: Call your Python script thankyouholoz0r.py
SIX
Go to PeakMonters
SEVEN
Log in
EIGHT
Go to my cards, and click the download as CSV save this in the directory holoz0r is awesome
NINE
Go to my land, and click the download as CSV, saving it also in the directory holoz0r is awesome
TEN:
Go back to your python interpreter.
ELEVENTY
Realise you need to install the pandas module if you haven't
THE DOZEN
Open your command prompt or terminal and type pip install pandas
THIRTEENTH Alt Tab back to your python interpreter
FOURTEENTH Type the code below
import pandas as pd
Congratulations, you've just imported your first python module.
Continue to type some stuff, to get information about the Splinterlands card collection from the Splinterlands API
cardinfo = pd.read_json("https://api2.splinterlands.com/cards/get_details")
Then, throw away the extra columns that we won't use again.
cardinfo.drop(["sub_type","drop_rate","is_starter","created_block_num","last_update_tx","total_printed","is_promo","tier","distribution"], axis=1, inplace=True)
Get the Pandas Module to read your collection of cards as a dataframe
collection = pd.read_csv("YOUR COLLECTION DOWNLOADED FROM PEAKMONSTERS.CSV")
The reason we are using the collection from peakmonsters instead of polling the API to get your collection, then figuring out the PP, is because I'm lazy, and the exceptional PeakMonsters team have already done the work.
Next, we're going to join your collection to the card info, to make it human readable.
You do this by creating a new data frame and merging the card details with the ids. This is the same as doing a JOIN function in SQL, but we're doing it using Python, instead.
finalproduction = collection.merge(cardinfo, left_on="card_detail_id", right_on="id")
Then, export it to a new CSV:
finalproduction.to_csv("finalproduction.csv")
Now, its time to tackle your land: Do the same for your filthy land plots, peasant:
deeds = pd.read_csv("YOUR MYLANDS FROM PEAKMONSTERS.CSV")
FIFTEEN: Use a beautiful table that I created that tells you how competent each type of monster is on each plot of land, and the best type for each land. Copy and paste the below, then save it as a CSV called holoz0rlandtable.csv, adding it to your holoz0r is awesome folder.
Note: These figures are subject to change, and I won't be updating this table each time they do
| Terrain Type | Fire | Water | Life | Death | Earth | Dragon | Neutral | Best Element 1 | Best Element 2 | Best Element 3 | Worst Element 1 | Worst Element 2 | Worst Element 3 |
|---|---|---|---|---|---|---|---|---|---|---|---|---|---|
| Badlands | 1.1 | 1 | 0.5 | 1.1 | 0.5 | 1 | 1 | Fire | Death | Neutral | Life | Earth | |
| Bog | 0.5 | 1.1 | 0.5 | 1.1 | 1 | 1 | 1 | Water | Death | Neutral | Life | Fire | |
| Caldera | 1.1 | 1 | 1 | 0.5 | 0.5 | 1.1 | 1 | Fire | Dragon | Neutral | Death | Earth | |
| Canyon | 1.05 | 0.9 | 0.9 | 1.05 | 0.9 | 1.05 | 1 | Fire | Dragon | Death | Water | Life | Earth |
| Desert | 1.1 | 0.5 | 0.5 | 1 | 1 | 1.1 | 1 | Fire | Dragon | Neutral | Water | Life | |
| Forest | 1 | 1 | 1.1 | 0.5 | 1.1 | 0.5 | 1 | Life | Earth | Neutral | Death | Dragon | |
| Hills | 1 | 0.5 | 1.1 | 0.5 | 1 | 1.1 | 1 | Life | Dragon | Neutral | Water | Death | |
| Jungle | 1 | 1 | 1.1 | 0.5 | 1.1 | 0.5 | 1 | Life | Earth | Neutral | Death | Dragon | |
| Lake | 0.5 | 1.1 | 1 | 1 | 1.1 | 0.5 | 1 | Water | Earth | Neutral | Fire | Dragon | |
| Mountain | 1.1 | 0.5 | 1 | 1.1 | 0.5 | 1 | 1 | Fire | Death | Neutral | Water | Earth | |
| Plains | 1 | 0.5 | 1.1 | 1 | 0.5 | 1.1 | 1 | Life | Dragon | Neutral | Water | Earth | |
| River | 0.5 | 1.1 | 1 | 1 | 1.1 | 0.5 | 1 | Water | Earth | Neutral | Fire | Dragon | |
| Swamp | 0.5 | 1.1 | 0.5 | 1.1 | 1 | 1 | 1 | Water | Death | Neutral | Fire | Life | |
| Tundra | 0.9 | 1.05 | 1.05 | 0.9 | 1.05 | 0.9 | 1 | Water | Life | Eartth | Fire | Death | Dragon |
Optional: Make a comment advising the table is wrong, and correct it yourself in the comments.
RIGHT: SIXTEENTH
Join my fancy table to your deed data. This code should look familiar if you've been paying attention:
terrain = pd.read_csv("holoz0rlandtable.csv")
landjoined = deeds.merge(terrain, left_on ="type", right_on="Terrain Type")
landjoined.to_csv("finallandmap.csv")
RUN THE CODE AS THE SEVENTEENTH STEP
Address any questions to stack overflow or chat gpt if you get an error.
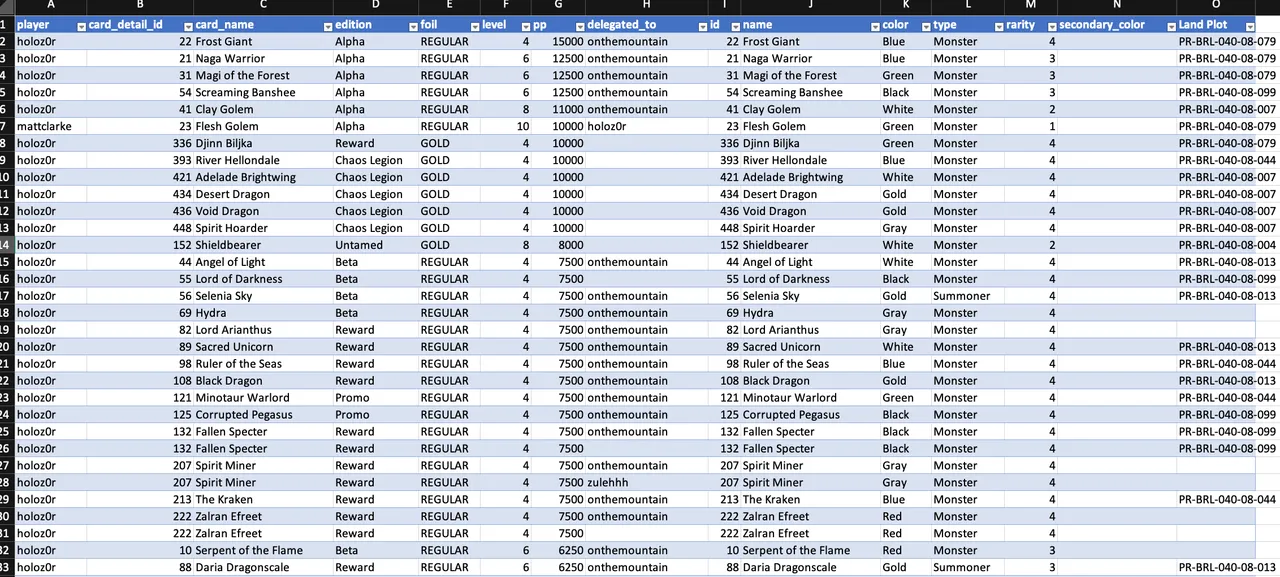
This concludes our time in Python... for now. The next step is to open each spreadhseet and observe in wonder as you have some stuff that looks like this:
finallandmap.csv

You'll see that your plots are now mapped to some useful information about them, such as whether they are magical, occupied, natural, rare, or any other number of informations.
You'll also see which Splinters, or elements as they may be called in the future; are going to be the very best for that specific plot of land.
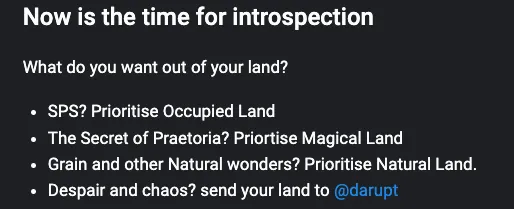
Now is the time for introspection
What do you want out of your land?
- SPS? Prioritise Occupied Land
- The Secret of Praetoria? Priortise Magical Land
- Grain and other Natural wonders? Prioritise Natural Land.
- Despair and chaos? send your land to @darupt
My order of preference is
- SPS
- Secret
- Natural Wonders
So what I'm going to do next is filter my land holdings by occupied, so I only see those plots in the list. I'm then going to look at hte terrain types and the best elements available for each:
In another window, I'm going to open my card collection.
You'll see that there are columns for the colour, and secondary colour (though, that only applies to Zyriel). Look at the type of land you want to priortise, then ensure your list of monsters is sorted by PP.
Next, filter it to only show the colours relevant to the "best elements" for that land plot you want to work on.
You'll see in the above, I've assigned various monsters to various lands, with a few of the neutrals left out. That's because mathematics is difficult, and we'll come back to decide where the neutral monsters of high production value will dwell at a later date.
Once you've iterated through each of your lands, and monster types that are suitable for that given land plot; it will be time to go back to Python for the final part of our enhancements, which will be to automatically add in the land types and other values, if you're running low on monsters and need to use stuff that might not be right for the land type, but could still have higher production than lower levelled cards.
In my case, I have a lot of Lakes and Rivers, so... fire creatures aren't going to work too well for me.
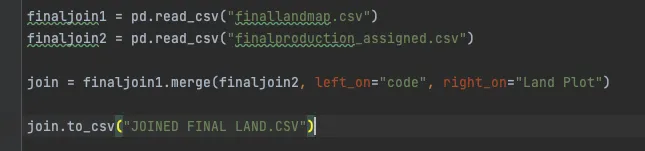
Anyway, enough rambling - do something like this in Python:
Now back to the guide
(and back to Excel)
Do you know what a pivot table is? No? Well, it is a useful tool in data analysis, and is basically a way more primitive form of the powerful "GROUP BY" functions used in data analysis to profile things or get them into groups based on certain flags or values. What I am going to do now is remind you of the fact that the monster type, monster level, terrain type, and terrain preference is not the only thing that can influence the final production.
There's titles.
There's Runi.
There's totems.
There's the amount of DEC you stake on that plot, but we don't know much, or anything about that at all.
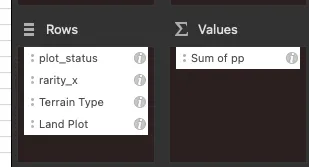
First, I want to create a SUPER MEGA ULTRA SUPERIOR pivot table that shows my production values by Type, rarity, plot, and also helpfully inform me which monster is on that land.
To do that, I create a table out of the joined data in the seperate step above, which was "Return of the Python".
Here is that pivot table:
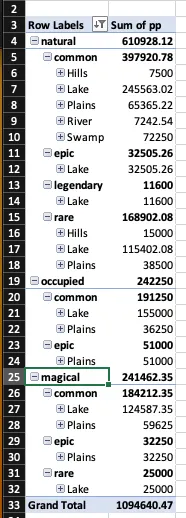
And here is the configuration:
If I then expand out another layer, it will show me the plots below...
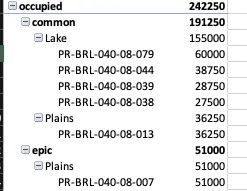
The above means that my common occupied land (based on the cards I've placed upon it, seems to have a higher production output than my epic land (based purely on the monster PP).
The next step beyond this is going in and looking at which monsters were assigned to which plot.
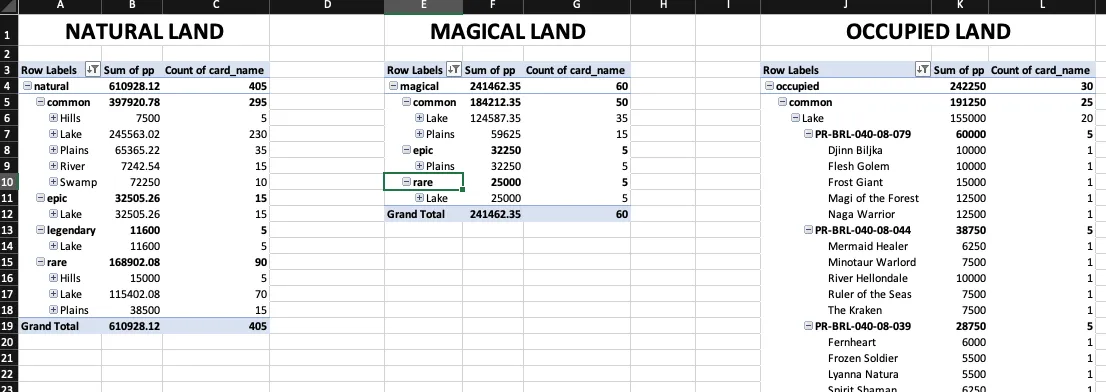
I also split the pivot tables by the type of land:
The final step as part of this is to assign titles, totems, and Runi to the various lands to increase their production points.
You would want to again do this in the order of your priorities, and apply multipliers to the production in the original rows of the table.
If you've gotten this far, you should be competent enough in spreadsheets to do this.
Want more content from me?
Witness my futile efforts to play my Steam Game collection in alphabetical order.
Are you aware that I love photography? Check out my work in a collection.

If you want to see my Splinterlands antics and rants live, Find me on Twitch
If you prefer sleeping in your designated time zone, go watch replays on YouTube.