SplinterStats is an information service providing battle statistics for the play-to-earn game Splinterlands. It's a Web3 game where you truly own your assets and earn rewards with real monetary value.
Splinterlands Season 163 has just concluded. The season lasted 17 days, commencing on July 14, 2025, at 14:00 GMT and ending on July 31, 2025, at 14:00 GMT. According to our records, a total of 238,907 battles took place during this season.
General Statistics by Battle Format in Season 163
The table below summarizes the total number of battles conducted throughout the entire season across all formats. It also shows the number of unique players, or rather unique user accounts, that participated in each of these battle formats during Season 163.
| Battle Format | Number of Battles | Unique Players |
|---|---|---|
| Brawl | 25,889 | 5,886 |
| Campaign | 9,780 | 1,189 |
| Challenge | 209 | 118 |
| Foundation | 4,401 | 1,177 |
| Modern | 80,216 | 3,396 |
| Survival | 22,910 | 920 |
| Tournament | 2,113 | 524 |
| Wild | 93,389 | 1,987 |
| Total | 238,907 | 8,967 |
| Summary table of Splinterlands battles in Season 163 |
In summary, a total of 8,967 unique players participated during Season 163.
Season 163 vs. Season 162 Comparison
To assess the evolution of player dynamics over time, it's always important to compare the statistics of a given season with the previous one. The following table shows this comparison and calculates the differences in the number of battles and unique users between both seasons.
| Format | Battles (S163) | Battles (S162) | Difference | Unique Players (S163) | Unique Players (S162) | Difference |
|---|---|---|---|---|---|---|
| Brawl | 25,919 | 31,533 | -5,614 | 5,886 | 5,873 | +13 |
| Campaign | 9,796 | 9,921 | -125 | 1,190 | 1,093 | +97 |
| Challenge | 209 | 387 | -178 | 118 | 136 | -18 |
| Foundation | 4,401 | 0 | +4,401 | 1,177 | 0 | +1,177 |
| Modern | 80,217 | 86,250 | -6,033 | 3,397 | 3,536 | -139 |
| Survival | 22,910 | 21,421 | +1,489 | 920 | 970 | -50 |
| Tournament | 2,122 | 2,163 | -41 | 525 | 481 | +44 |
| Wild | 93,415 | 78,488 | +14,927 | 1,987 | 1,968 | +19 |
| Total | 238,989 | 230,163 | +8,826 | 8,967 | 8,678 | +289 |
The table shows that in Season 163, there were 8,826 more battles than in the previous season, and 289 more unique players participated. Even though the difference is relatively small, there's a 1.5% increase in unique player participation, which, regardless of the analysis scenario, represents a positive data point for the Splinterlands ecosystem.
In Season 163, 352 accounts or players participated simultaneously in both the Modern and Wild formats. In Season 162, there were 368 unique players who participated simultaneously in both Modern and Wild formats.
Evolution of Battle Count Throughout the Season
The following chart displays the total number of daily battles we recorded throughout Season 163 across all battle formats. We can clearly see that in Splinterlands, during this season, between 11 thousand and 17 thousand battles took place daily. Approximately 80% are represented by the Modern and Wild formats, shown in the graph by purple and gray colors, respectively. Only when brawls occur do these proportions change, and the number of battles for those days significantly increases. Brawls are represented by the blue color in the graph.
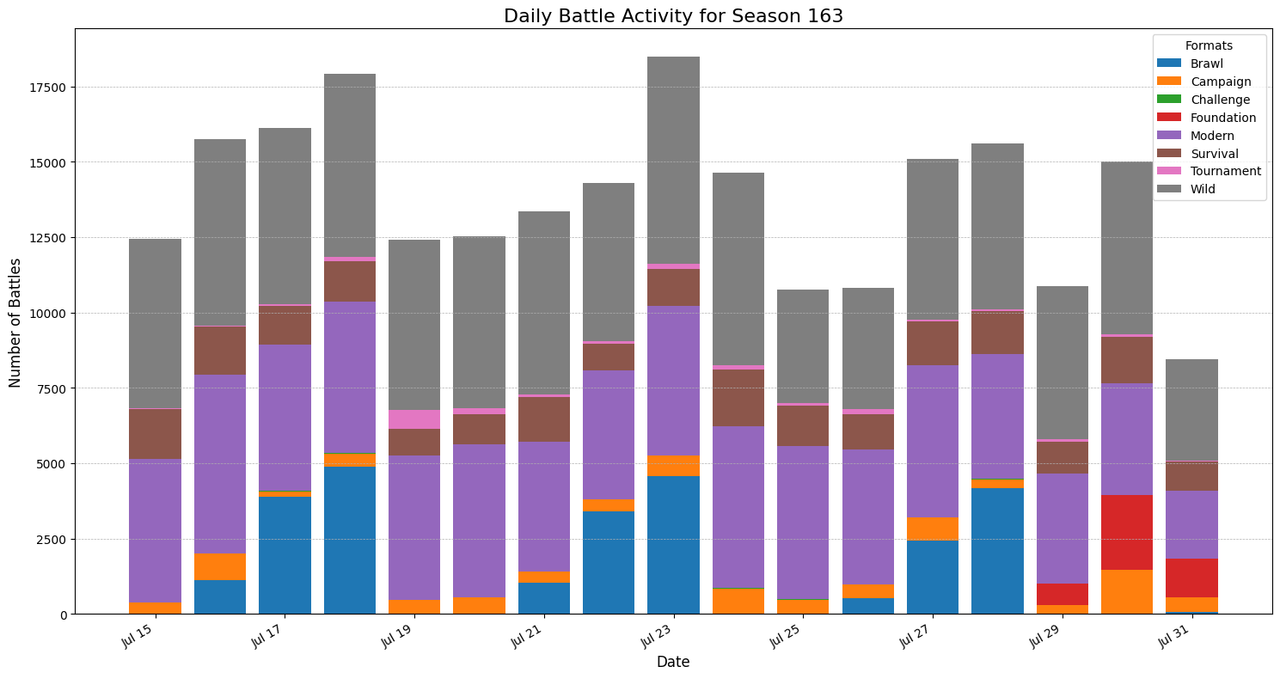
This graph is interesting because it shows the daily breakdown of battles that lead to the overall season statistics table results.
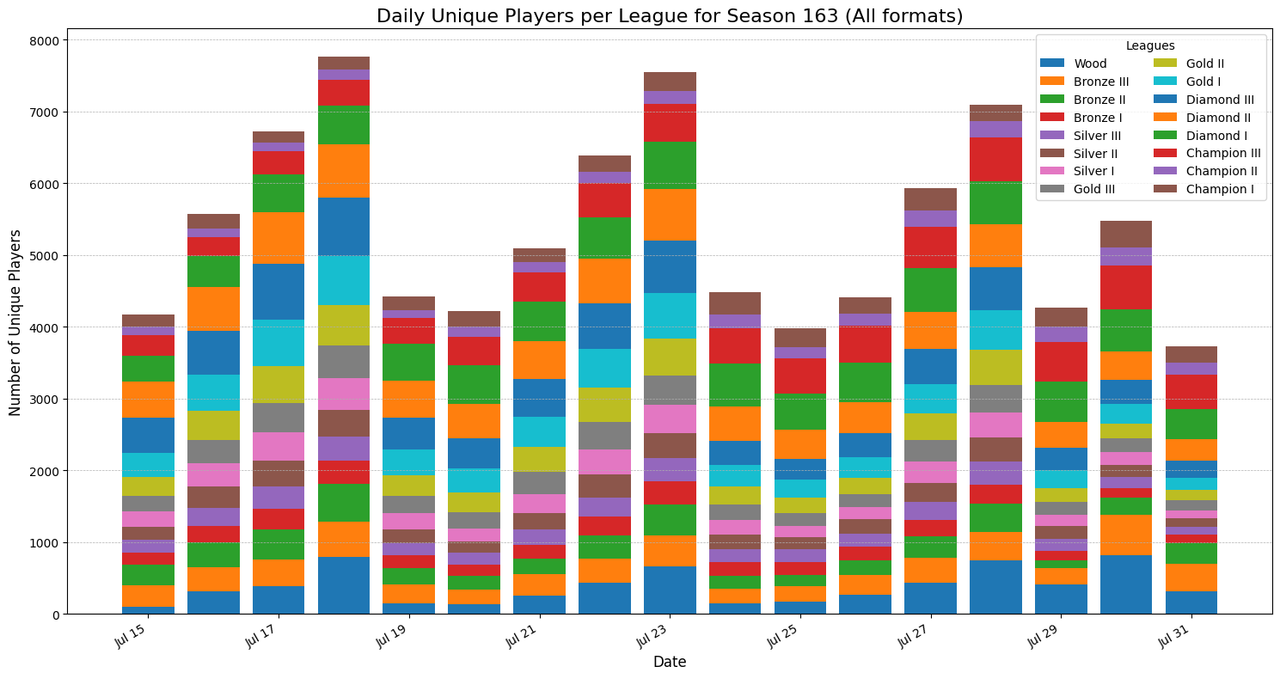
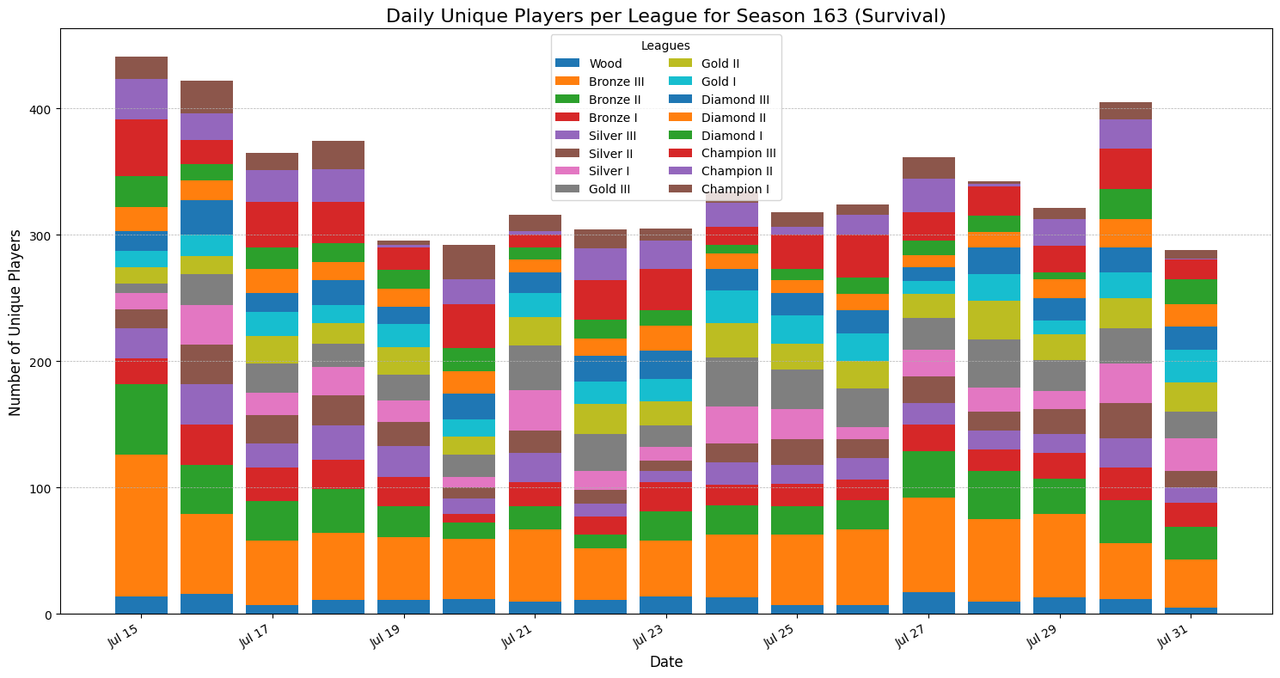
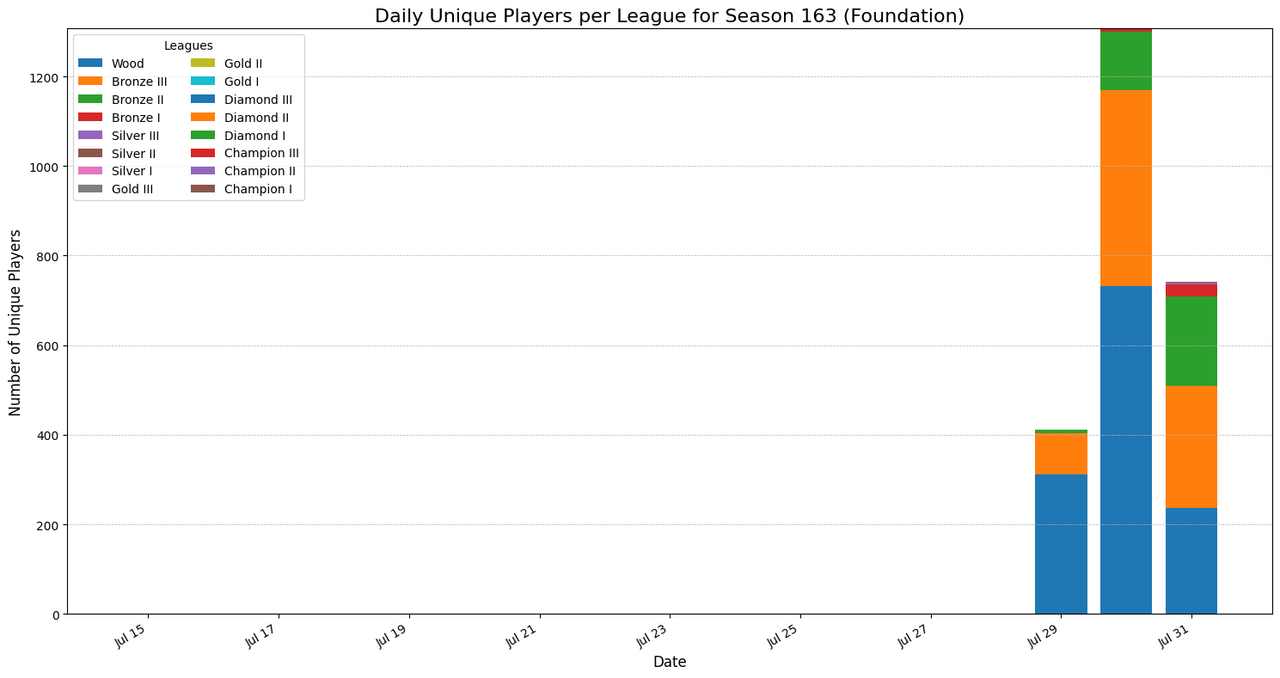
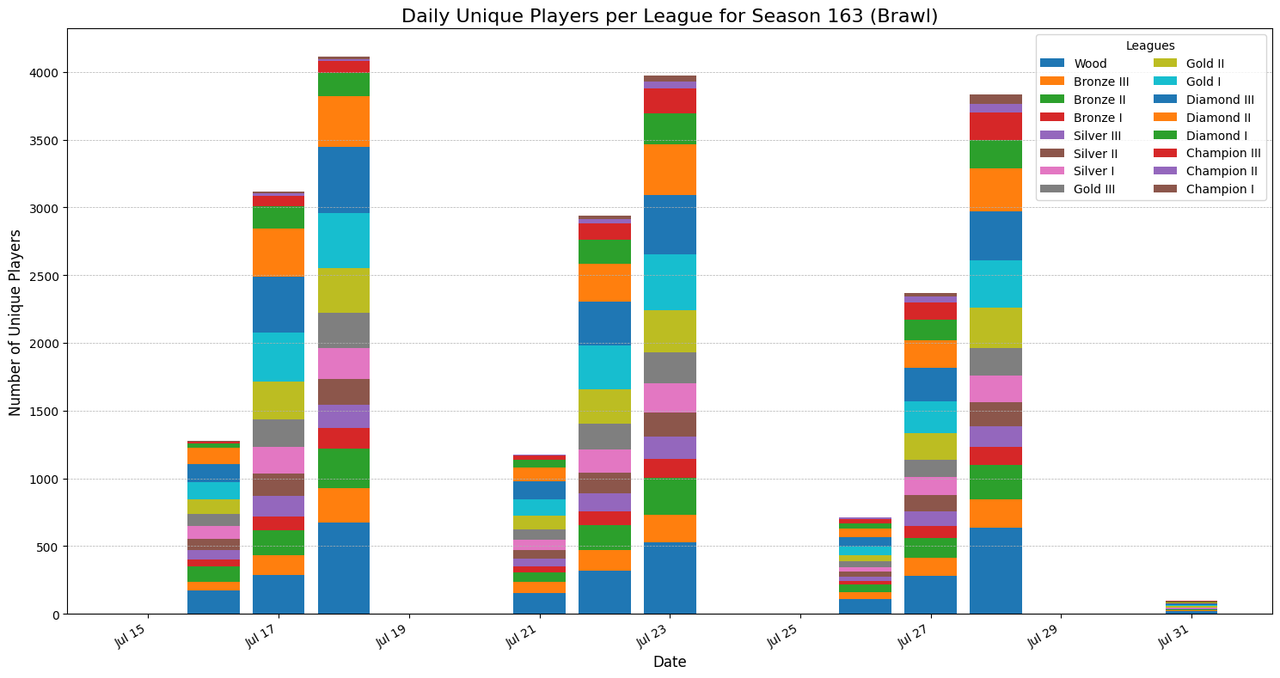
Analysis of Unique Players per Day by League
Below are charts showing the number of unique players per day per league for each battle format. This information is very insightful and clearly illustrates the dynamics and distribution of players across various formats.
GRAPH OF UNIQUE PLAYERS PER DAY PER LEAGUE IN ALL FORMAT
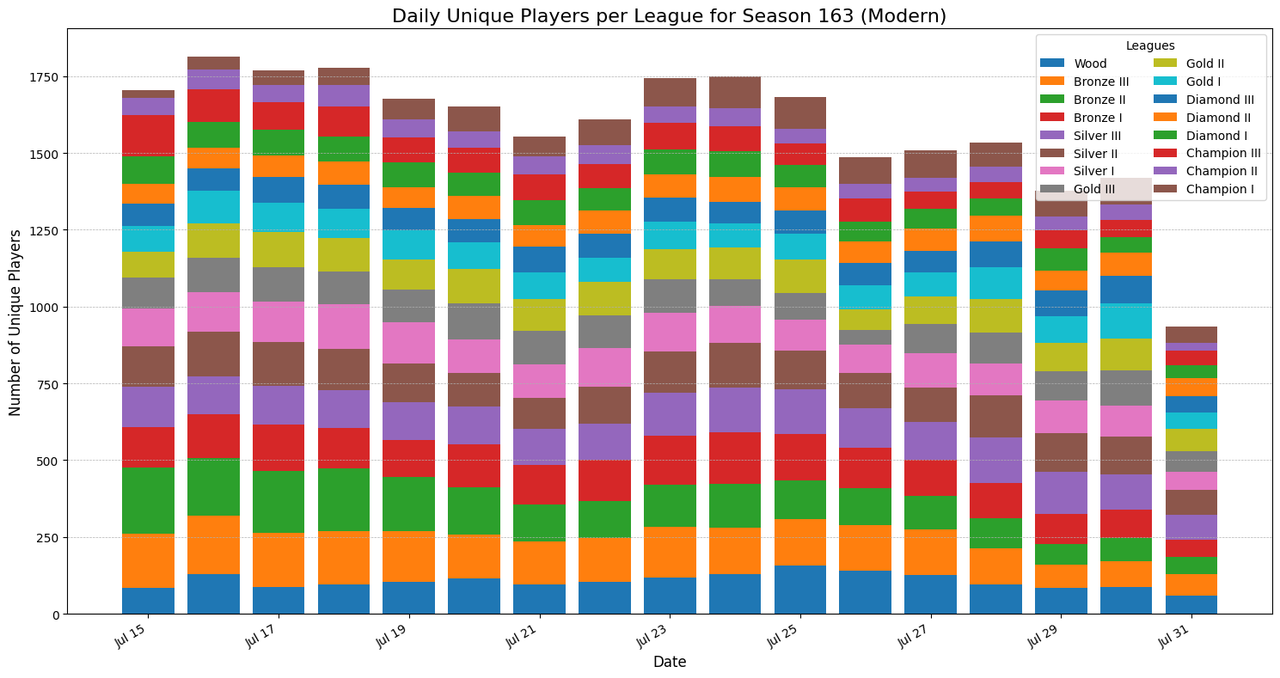
GRAPH OF UNIQUE PLAYERS PER DAY PER LEAGUE IN MODERN
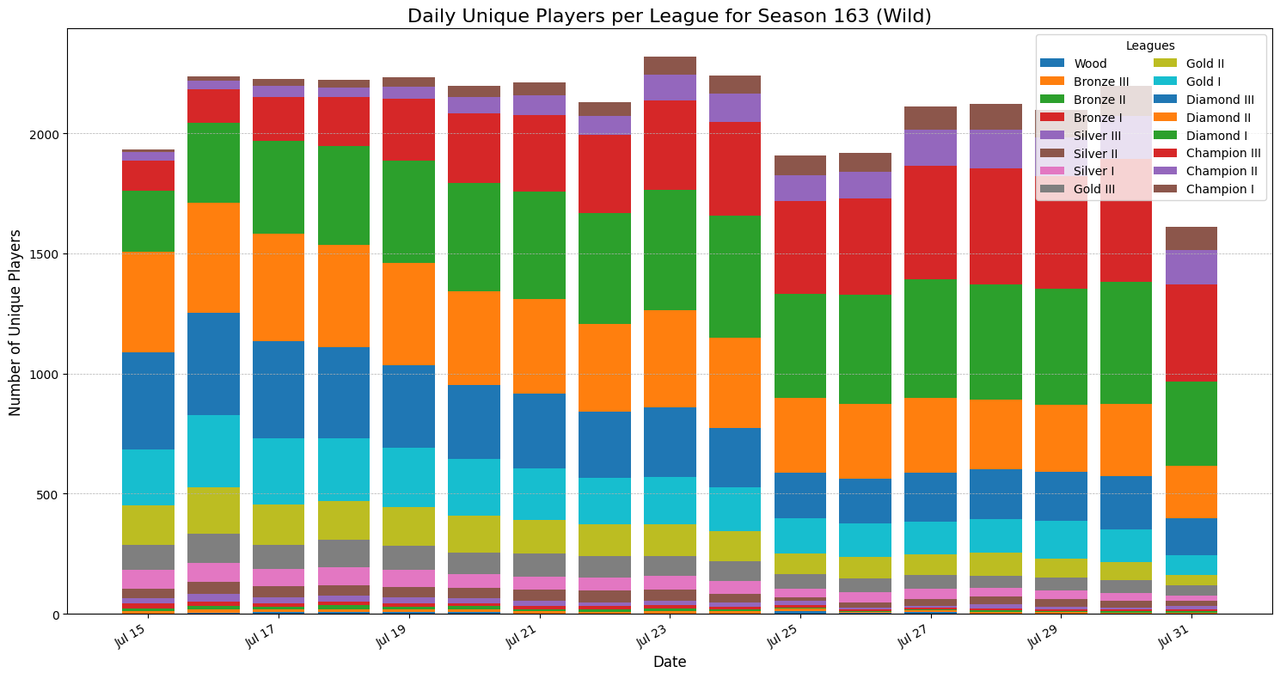
GRAPH OF UNIQUE PLAYERS PER DAY PER LEAGUE IN WILD
GRAPH OF UNIQUE PLAYERS PER DAY PER LEAGUE IN SURVIVAL
GRAPH OF UNIQUE PLAYERS PER DAY PER LEAGUE IN FOUNDATION
GRAPH OF UNIQUE PLAYERS PER DAY PER LEAGUE IN BRAWLS
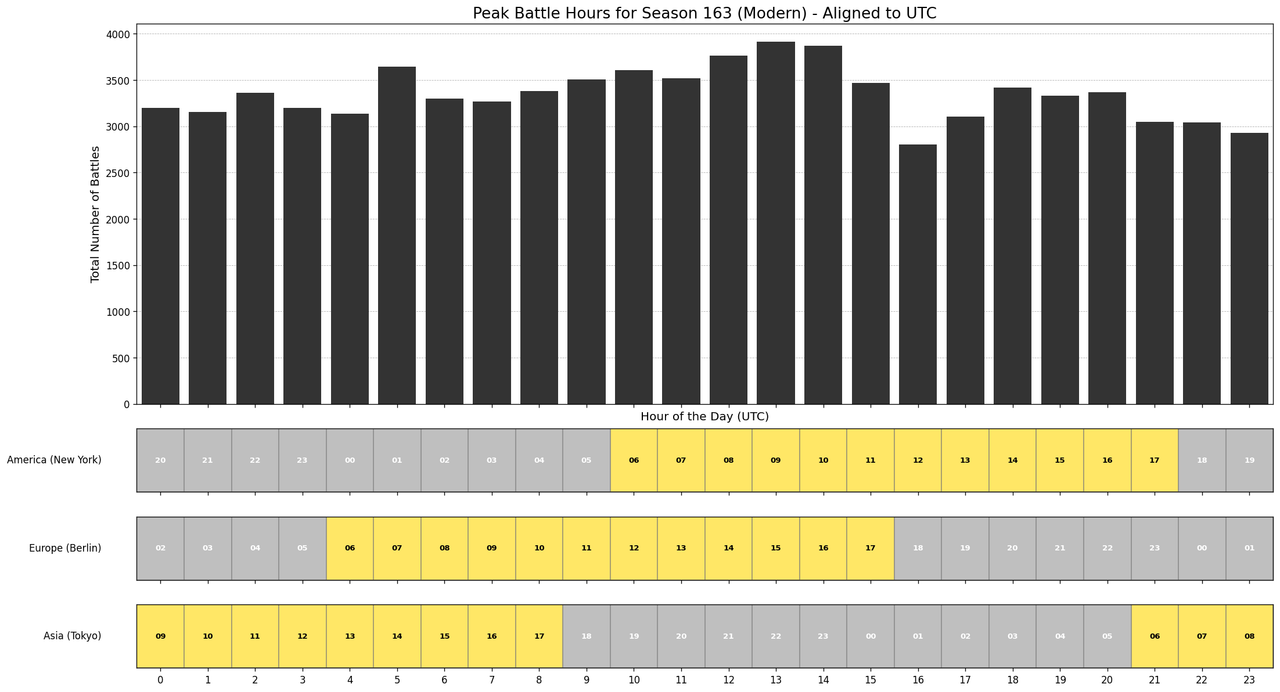
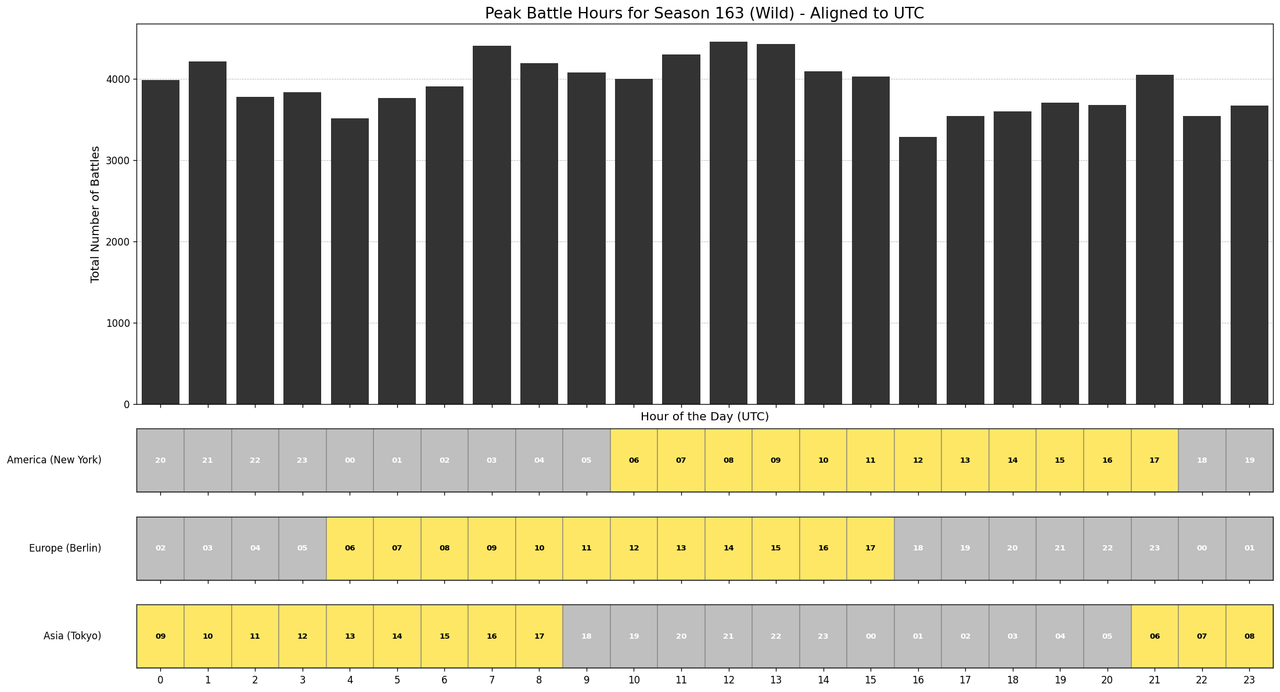
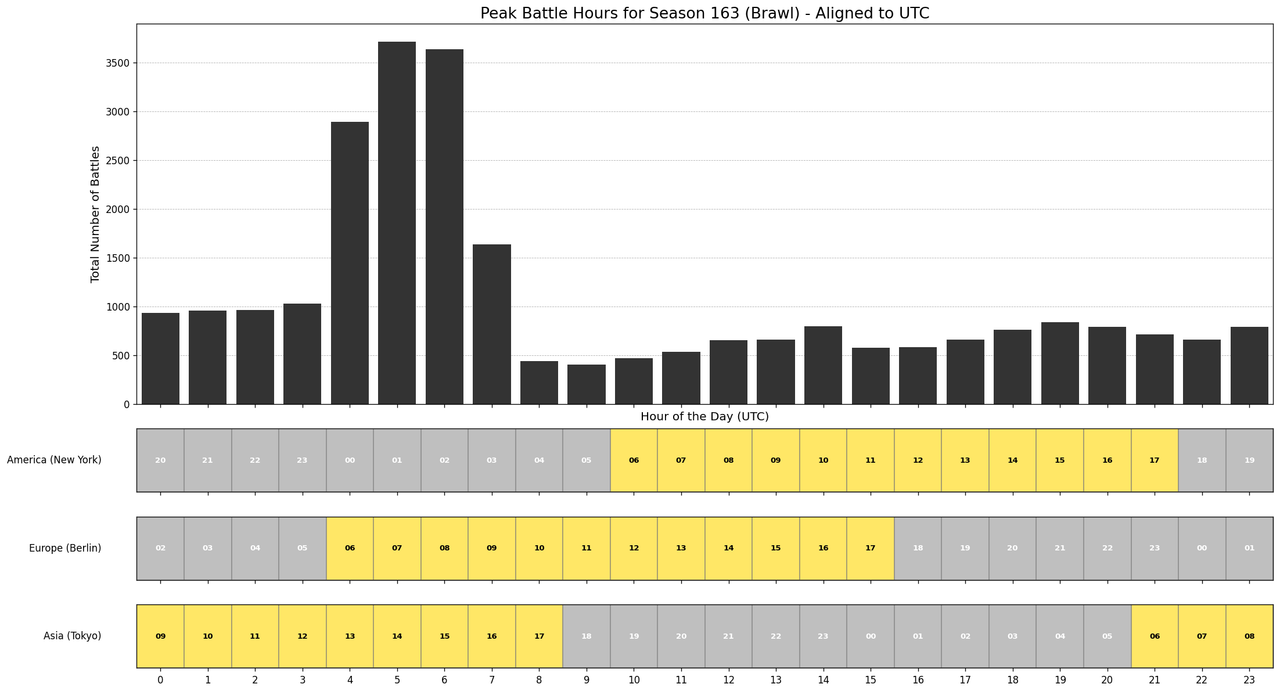
What Time Was Splinterlands Played During Season 163?
The following chart displays the number of battles per hour throughout the day in Season 163 for each battle format. The graph that caught my attention the most was the one for Brawls, because it seems like all Splinterlands players agree to play at the same time. Extremely interesting!
GRAPH OF UNIQUE PLAYERS PER DAY PER HOUR IN MODERN
GRAPH OF UNIQUE PLAYERS PER DAY PER HOUR IN WILD
GRAPH OF UNIQUE PLAYERS PER DAY PER HOUR IN BRAWLS
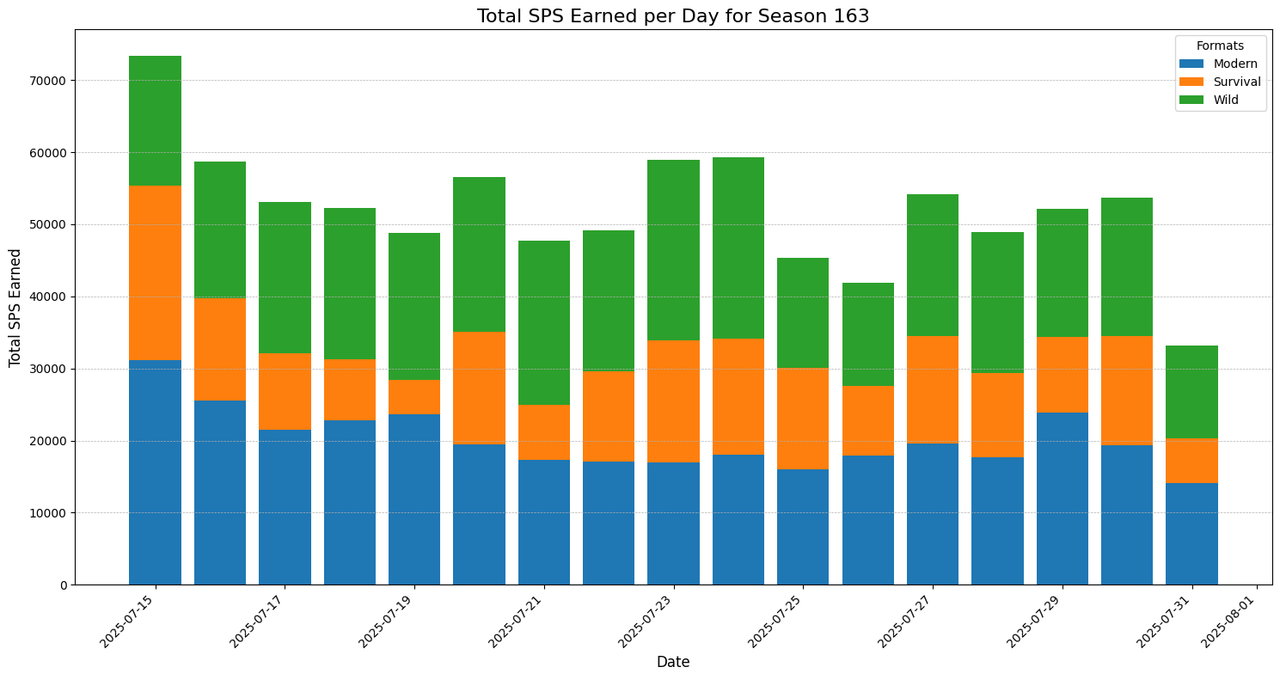
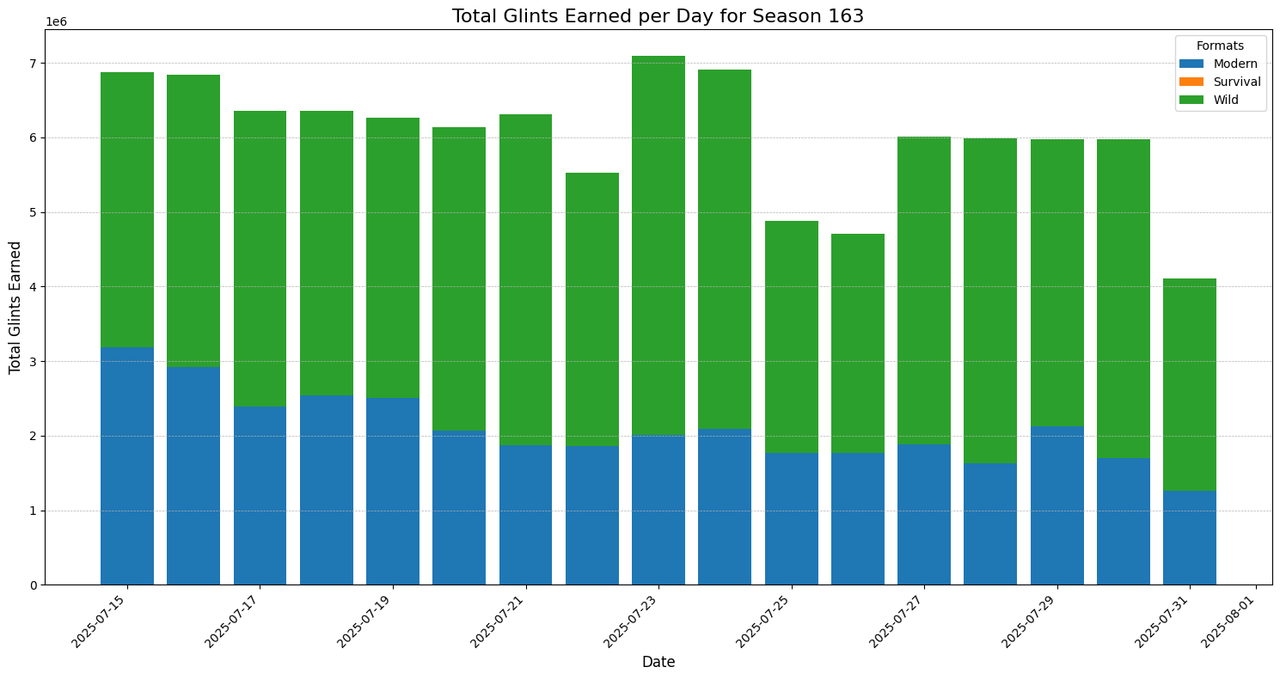
Financial Aspect: SPS and Glints Earned in Season 163
Undoubtedly, the statistics on how much SPS and Glints players earn throughout a season are of utmost importance to everyone.
Below are graphs showing the total number of SPS and Glints earned by players in each format. These graphs allow us to observe the daily distribution of SPS and Glints in each format, but they don't give us an idea of how much each player earns on average.
GRAPH OF SPS EARNED PER DAY IN THE SEASON
GRAPH OF GLINTS EARNED PER DAY IN THE SEASON
To get an idea of how much SPS players earn in Splinterlands, we need to sum all daily earnings for each player and perform the corresponding statistical analysis. However, creating a graph that is easy to analyze with such a wide dispersion of values is a monumental task. As my interest is focused on showing information that truly concerns the vast majority of players, I have decided to present these results in a box plot.
GRAPH OF EARNINGS IN BOX-PLOT.
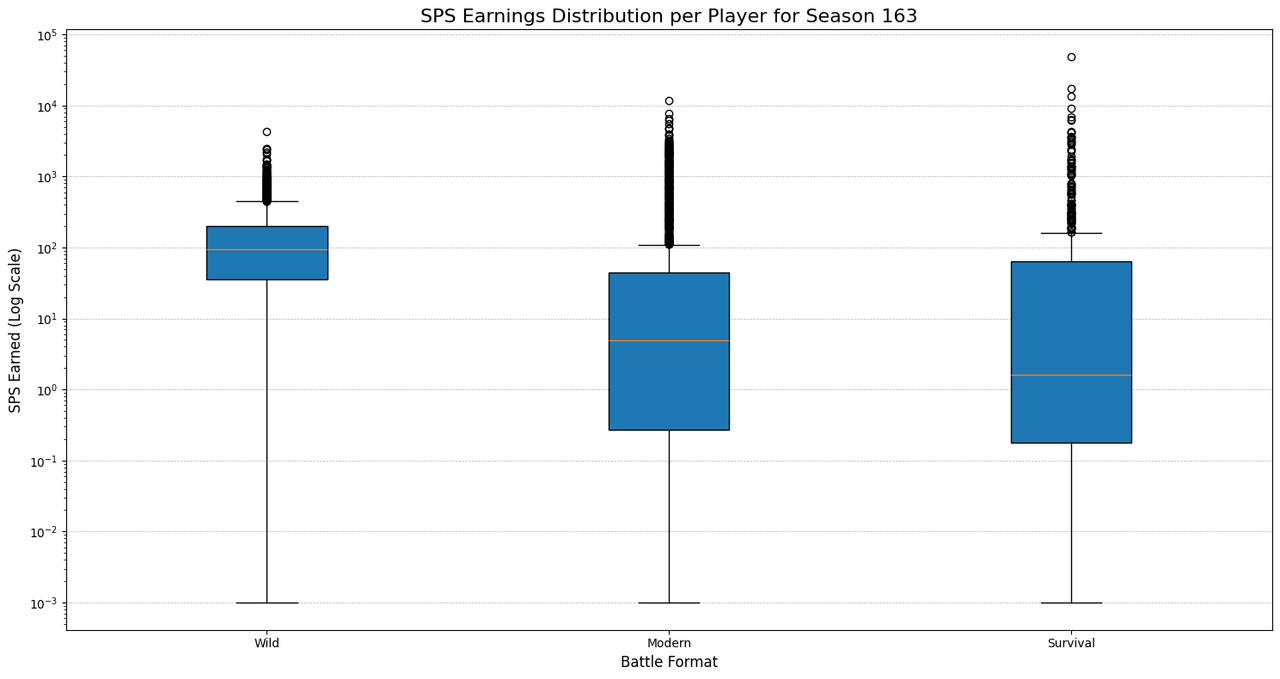
A box plot (also known as a box-and-whisker plot) is a standardized way of displaying the distribution of data based on five key numbers: the minimum, the first quartile (Q1), the median, the third quartile (Q3), and the maximum. This type of graph is useful for visualizing data dispersion and skewness, as well as identifying outliers.
The central line inside the box represents the median (the 50th percentile of the data). This indicates the central value of SPS earnings for players in that format.
The bottom edge of the box is the first quartile (Q1) (the 25th percentile of the data). 25% of players earned SPS below this value.
The top edge of the box is the third quartile (Q3) (the 75th percentile of the data). 75% of players earned SPS below this value.
The height of the box (Q3 - Q1) represents the interquartile range (IQR), which contains the central 50% of the data. A shorter box indicates that most players have similar SPS earnings, while a longer box suggests greater variability.
The whiskers are the lines extending from the box and indicate the spread of data outside the IQR. Generally, they extend to the lowest and highest values within 1.5 times the IQR from the box edges. These whiskers represent the range of "typical" or expected earnings.
Outlier points are individual points beyond the whiskers and represent atypical values (outliers) in the analyzed data. These represent players with significantly higher or lower SPS earnings than most players in that format.
Thus, from the box-plot graph, it can be deduced with relative ease that, on average, players in the Wild format earn more SPS than players in the Modern and Survival formats. Similarly, it can be inferred that players earn more SPS in the Modern format than in the Survival format.
In the Wild format, most players earn roughly the same, ranging between 60 and 120 SPS, with a median of 100 SPS per season. In contrast, the Modern format shows greater dispersion, with players earning in the range of 20 to 60 SPS per season, with a median of only 8 SPS per season. In the Survival format, the dispersion is much greater, with players earning from less than 1 SPS up to 70 SPS per season, and a median of only 2 SPS.
Top 20 SPS Earners per Format - Season 163
Of course, we have the outliers, who are those players who are completely off the charts and are well represented in the upper whiskers. Here is the table with the top 20 players who earned the most SPS throughout the season.
Format: Wild
| Rank | Player | SPS Earned |
|---|---|---|
| 1 | bubke | 4299.70 |
| 2 | tameshon | 2462.50 |
| 3 | nitekichi | 2456.05 |
| 4 | bravetofu | 2380.22 |
| 5 | endgegner | 2181.09 |
| 6 | vugtis | 2060.33 |
| 7 | matt-dub | 1740.57 |
| 8 | bluestreak240 | 1713.87 |
| 9 | tehox | 1662.16 |
| 10 | jeffopenscards | 1498.12 |
| 11 | kiokizz | 1489.67 |
| 12 | orrkis | 1450.48 |
| 13 | warterah2 | 1398.55 |
| 14 | newageinv | 1393.59 |
| 15 | davel22 | 1373.09 |
| 16 | sprstoner | 1364.32 |
| 17 | cryptoreaper | 1345.35 |
| 18 | beaux199 | 1330.03 |
| 19 | gondonar | 1328.55 |
| 20 | gustavhaas | 1249.11 |
Exportar a Hojas de cálculo
Format: Modern
| Rank | Player | SPS Earned |
|---|---|---|
| 1 | kesryn | 11569.24 |
| 2 | housewifeftw | 7800.37 |
| 3 | lorkus | 6439.26 |
| 4 | hanv | 6195.99 |
| 5 | emp-warden | 5574.86 |
| 6 | magehan | 4855.67 |
| 7 | bulldog1205 | 4734.02 |
| 8 | samwiseg | 4682.51 |
| 9 | ank2020 | 3939.84 |
| 10 | maisiewss | 3883.85 |
| 11 | xawi | 3776.22 |
| 12 | xsuilx | 3461.94 |
| 13 | dratek | 3225.35 |
| 14 | azircon | 3182.85 |
| 15 | instamental | 3170.15 |
| 16 | shadecroat | 3061.20 |
| 17 | tarazkp | 3032.27 |
| 18 | pancholfugazi | 2949.35 |
| 19 | dlacerda7 | 2899.13 |
| 20 | bjangles | 2840.32 |
Exportar a Hojas de cálculo
Format: Survival
| Rank | Player | SPS Earned |
|---|---|---|
| 1 | vugtis | 48469.83 |
| 2 | instamental | 17279.18 |
| 3 | bravetofu | 13615.95 |
| 4 | dratek | 9112.29 |
| 5 | jmaan | 6993.42 |
| 6 | michealb | 6395.69 |
| 7 | neal.cards | 6129.72 |
| 8 | sweenyswift | 4350.49 |
| 9 | bltzr-wizard-701 | 4208.33 |
| 10 | jeffopenscards | 4155.97 |
| 11 | nichtwiesie | 3617.01 |
| 12 | hanv | 3616.24 |
| 13 | mastershonuff | 3511.34 |
| 14 | milomex | 3474.85 |
| 15 | bamlolx | 3230.80 |
| 16 | mythic534 | 3074.85 |
| 17 | imperij4427 | 3047.15 |
| 18 | ducecrypto | 2893.88 |
| 19 | kolokee | 2804.82 |
| 20 | sprstoner | 2387.07 |
The Splinterlands Battle Information Service
I hope the information presented is useful and well-received by the community. I feel like I've included too many graphs and numbers, which might make the post seem complicated. However, please keep in mind that I've made my best effort to present the information in the most digestible way possible. I await your comments, suggestions, and especially hope you can tell me what kind of information you consider useful and necessary to standardize these statistical reports.
All these graphs that I'm showing in the post, and those I'll show in future publications, are part of the battle information service. I'm still in the implementation process, but very soon, by sending a message to my account, you'll be able to receive these graphs and data tables as a response. You'll also be able to request specific information for each player or battle. However, the process is slow and requires a lot of time, resources, and concentration, which I don't have in abundance right now.
Thank you very much for reading and for your support...
"Splinterlands: Play, Win, Own. The Web3 game that rewards you."
Posted using Splintertalk