Welcome to the monthly financial report about the Hive blockchain.
All the information presented in this report is based on the data collected from the blockchain until 2025-06-30 midnight UTC. This report aims to provide you with a clear view of what is happening on the Hive blockchain.
1. Price
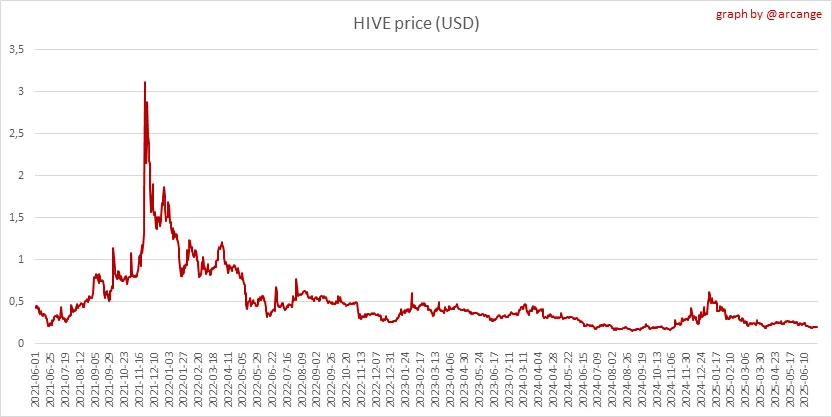 | 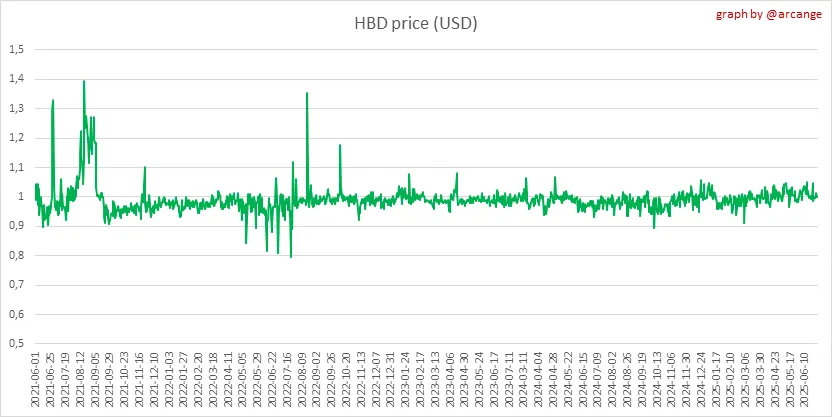 |
These graphs show the evolution of prices in USD for HIVE and HBD.
2. Supply
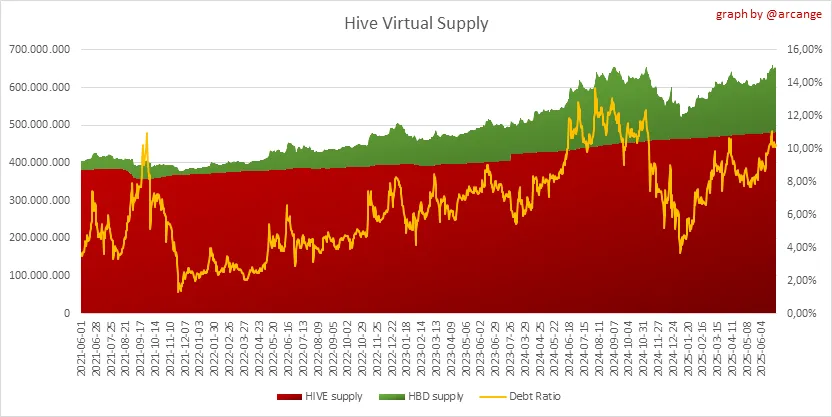
This graph shows the evolution of HIVE virtual Supply. The virtual supply is the sum of HIVE supply (liquid and staked HIVE) and HBD supply (converted into HIVE).
The graph also displays the debt ratio (HBD supply / HIVE virtual supply). Keep in mind that since hardfork 24 funds in the treasury (@hive.fund HBD balance) don't count towards the HBD debt ratio.
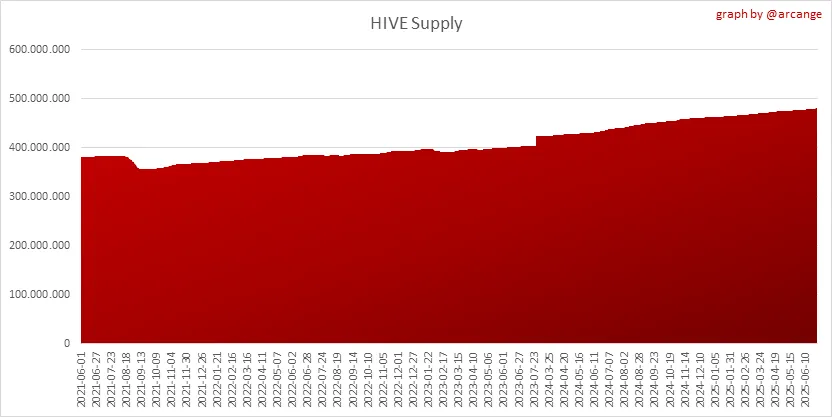 | 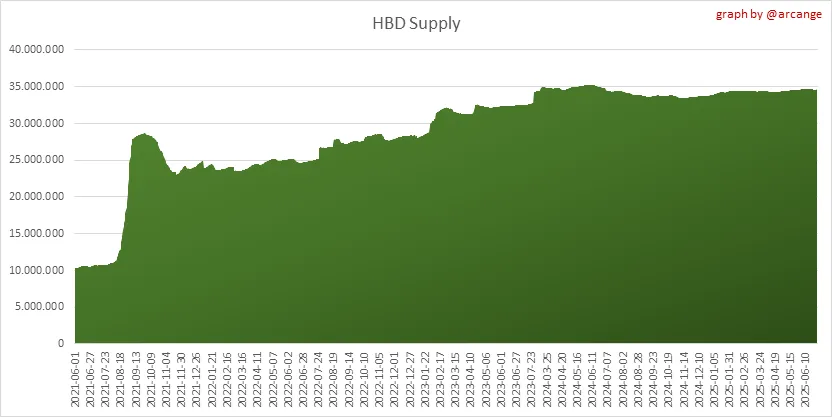 |
These graphs show the evolution of the HIVE Supply (both liquid and staked) and the HBD supply.
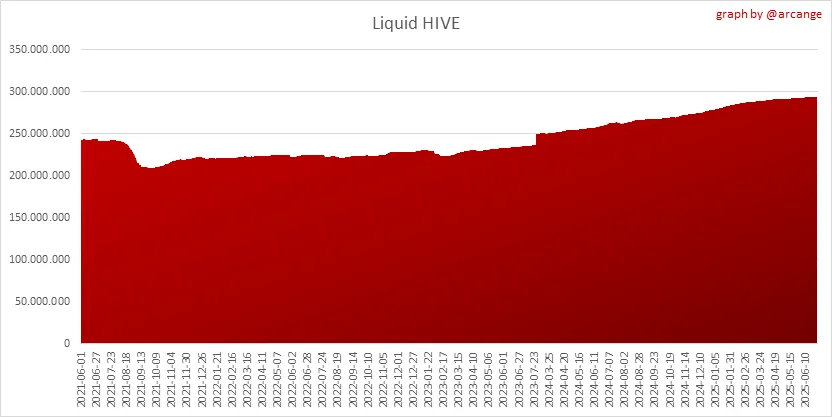 | 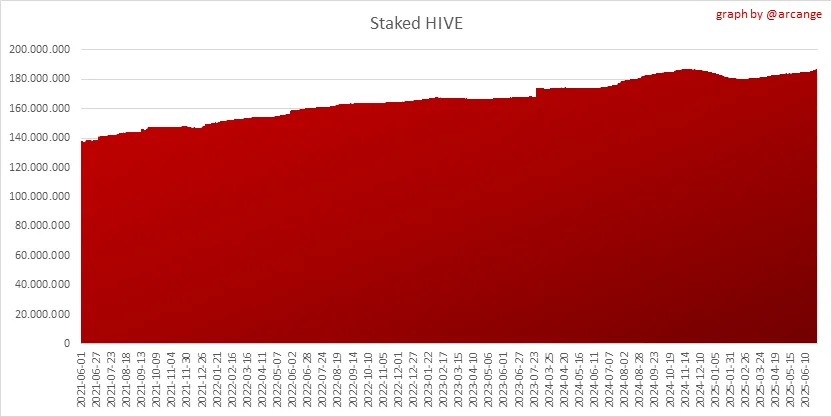 |
These charts show the evolution of the liquid HIVE and the staked HIVE (Hive Power).
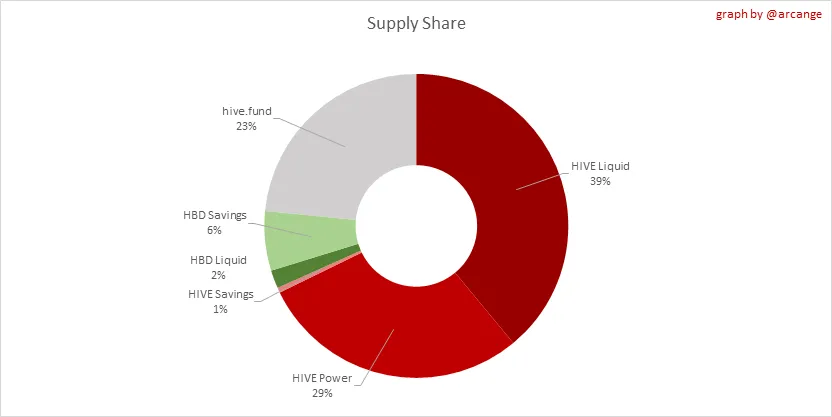
This graph shows the overall Hive tokens distribution.
3. HBD Savings
| Account | Deposit | Account | Withdrawal |
|---|---|---|---|
| @roundbeargames | 17,270.146 HBD | @vaultec | 9,982.000 HBD |
| @anhdaden146 | 2,095.004 HBD | @letusbuyhive | 2,500.000 HBD |
| @resiliencia | 436.668 HBD | @jenthoughts | 600.000 HBD |
| @ruggbby13 | 402.066 HBD | @wapitielk | 246.000 HBD |
| @woelfchen | 360.154 HBD | @shady | 146.958 HBD |
| @new.things | 244.000 HBD | @yetaras | 108.604 HBD |
| @distriator.loans | 181.189 HBD | @splinterdany | 100.000 HBD |
| @asas27 | 161.653 HBD | @lizelle | 92.427 HBD |
| @fundacja | 104.762 HBD | @monochiralmonkey | 50.000 HBD |
| @joele | 103.553 HBD | @sevatar | 50.000 HBD |
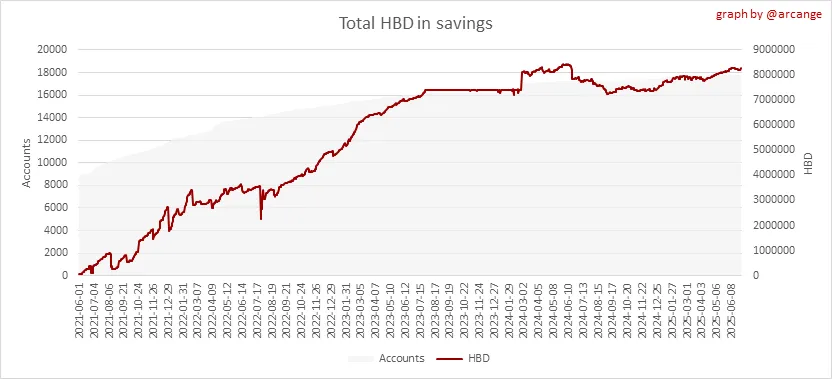
This graph shows how much and how many accounts store HBD in savings. The table below shows the topmost HBD deposits and withdrawals of the day.
Note: As of 2021-06-30 (HF25) interest is only paid for HBD which are stored in savings.
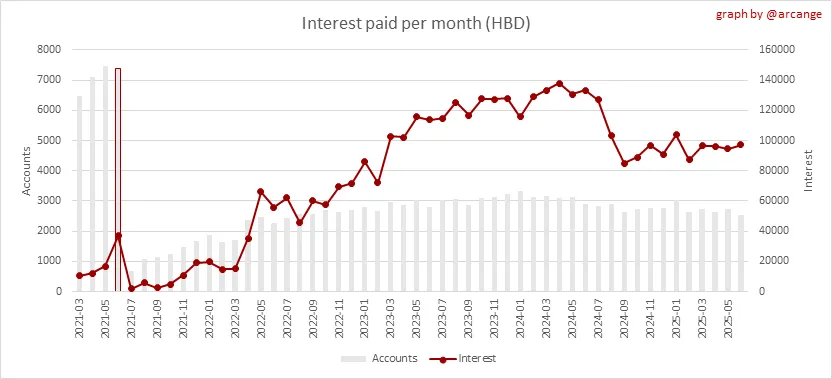
This chart shows the amount of interest paid each month for holding HBD and how many accounts received such interest.
4. Balances
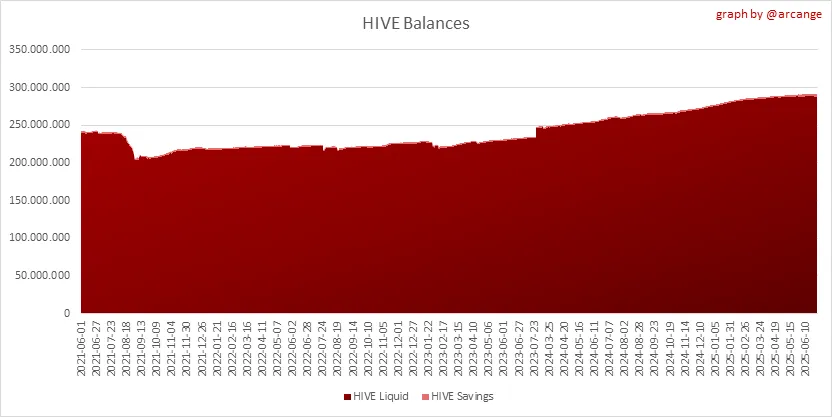
This graph shows the number of HIVE, both liquid and in savings, held by all accounts.
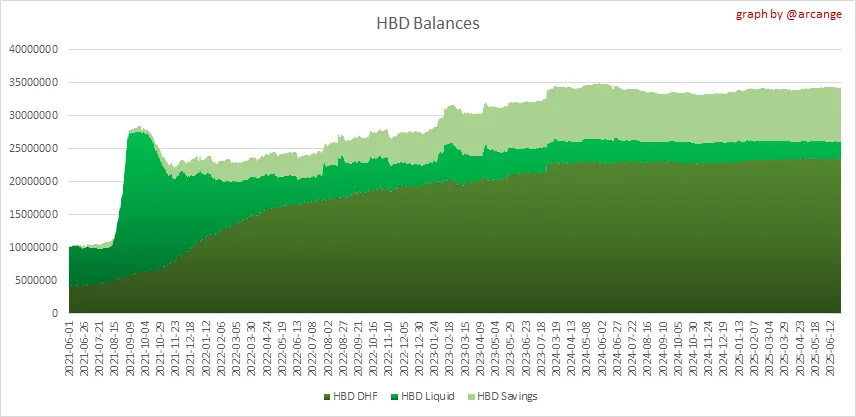
This graph shows the number of HBD, both liquid and in savings, held by all accounts. It also displays the amount of HBD stored in the Decentralized Hive Fund (DHF).
5. Conversions
Note: As a reminder, conversion requests are only finalized after 3 days. It is only then that it is known exactly how many HIVE were burned in return for the HBD received at the time of the conversion request.
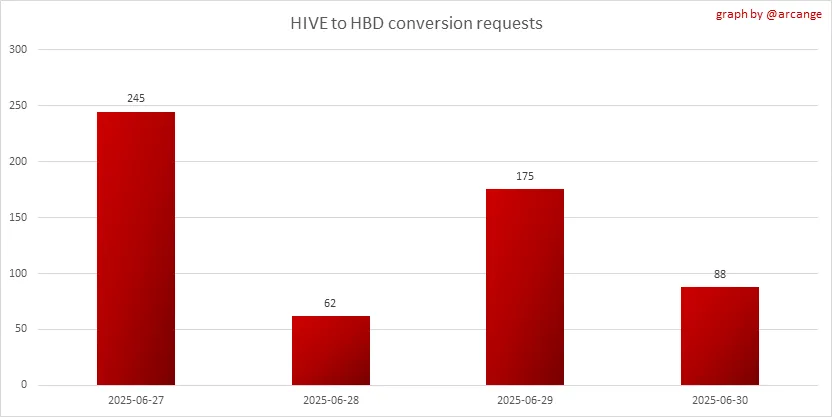
This graph shows the number of HIVE collateralized due to requests to convert HIVE to HBD over the past few days.
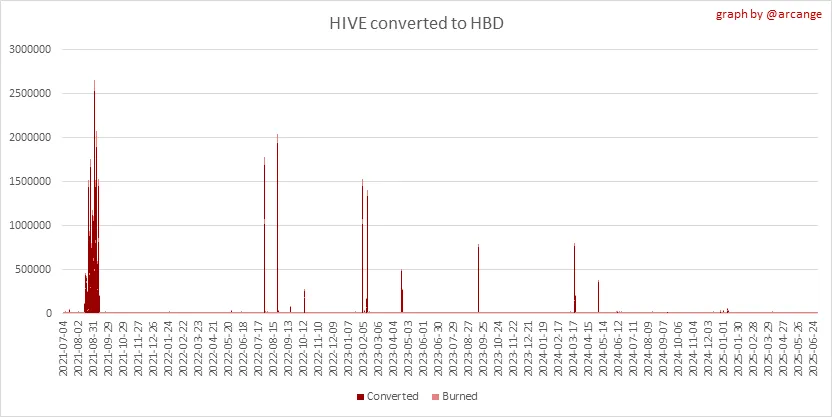 | 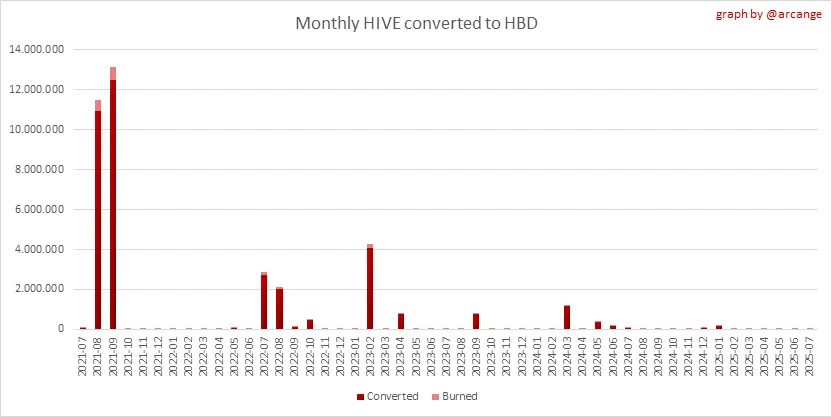 |
These graphs show the number of HIVE effectively used by the conversion process (HIVE converted and 5% HIVE fee which is burned) each day and month when requests to convert HIVE to HBD have been finalized.
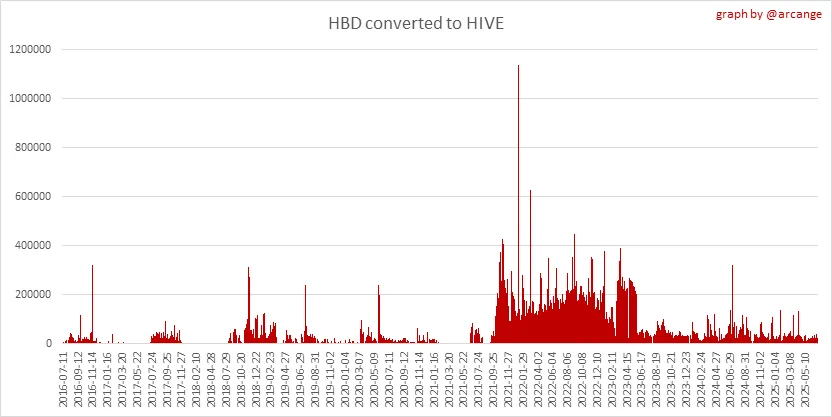 | 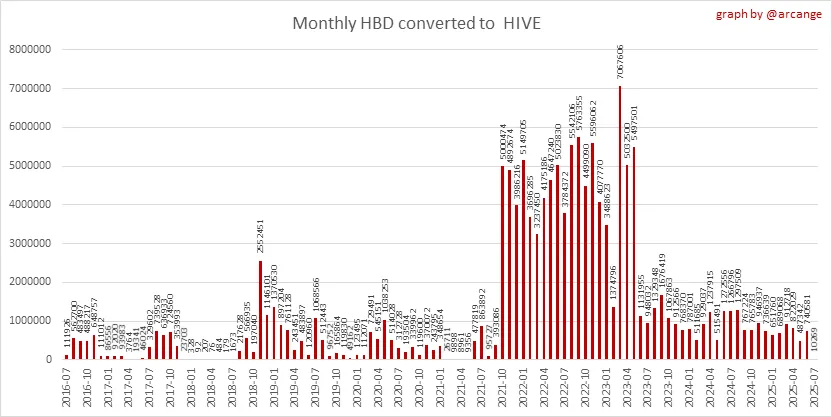 |
These graphs show the number of HBD burned, each day and each month, following requests to convert HBD to HIVE.
6. Powerup and Powerdown
| Date | Account | Amount |
|---|---|---|
| 2025-06-30 07:49:42 | @nomnomnomnom | 29,252.402 HIVE |
| 2025-06-30 07:30:54 | @the-lead | 2,724.151 HIVE |
| 2025-06-30 11:16:57 | @coffeedrinker51 | 2,000.169 HIVE |
| 2025-06-30 09:43:48 | @konchix | 1,752.212 HIVE |
| 2025-06-30 04:46:18 | @yendu | 1,176.878 HIVE |
| 2025-06-30 02:06:54 | @limonta | 1,142.386 HIVE |
| 2025-06-30 10:59:27 | @soy-laloreto | 1,106.048 HIVE |
| 2025-06-30 05:03:18 | @nill2021 | 729.540 HIVE |
| 2025-06-30 09:04:36 | @leomarylm | 456.312 HIVE |
| 2025-06-30 08:35:09 | @ganzoapproved | 294.723 HIVE |
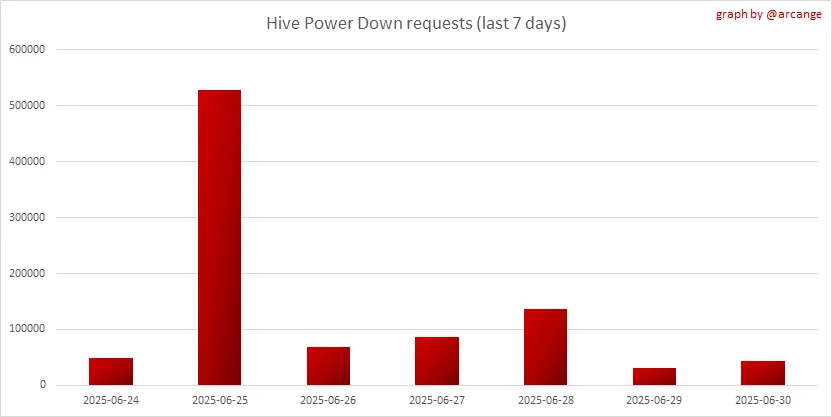
This graph and table show the amount of powerdown initiated over the last 7 days, and the largest initiated on this day.
| Account | Powerup | Account | Powerdown |
|---|---|---|---|
| @nainaztengra | 15,000.000 HIVE | @emrebeyler | 23,158.645 HIVE |
| @wayfar | 1,717.488 HIVE | @dwayne16 | 7,980.541 HIVE |
| @dbooster | 1,000.000 HIVE | @fortune1m | 2,958.746 HIVE |
| @thegaillery | 904.296 HIVE | @megadrive | 2,653.204 HIVE |
| @mes | 717.000 HIVE | @ausbitbank | 2,518.424 HIVE |
| @karja | 639.993 HIVE | @nomnomnomnom | 1,969.819 HIVE |
| @kimzwarch | 500.000 HIVE | @tunak | 1,583.958 HIVE |
| @luisecarreno | 490.480 HIVE | @curie | 1,386.252 HIVE |
| @lordnasty | 349.293 HIVE | @atyh | 1,005.164 HIVE |
| @chaos23 | 300.002 HIVE | @shanibeer | 1,002.898 HIVE |
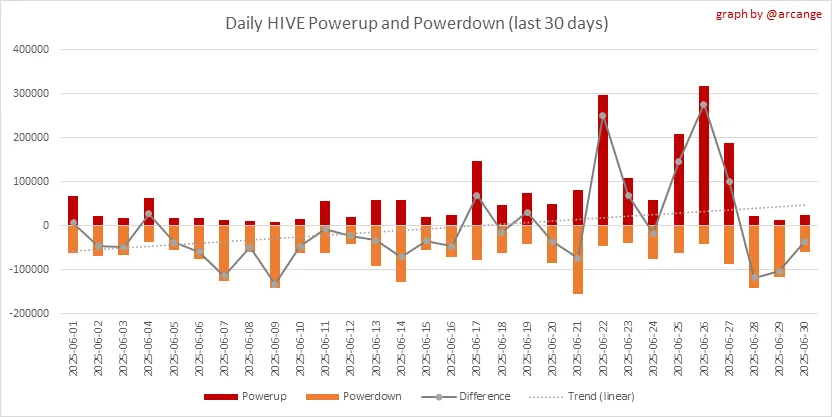
This graph shows the daily HIVE power-up, power-down, and the resulting variation over the last 30 days. The table shows the topmost power-ups and power-downs of the day.
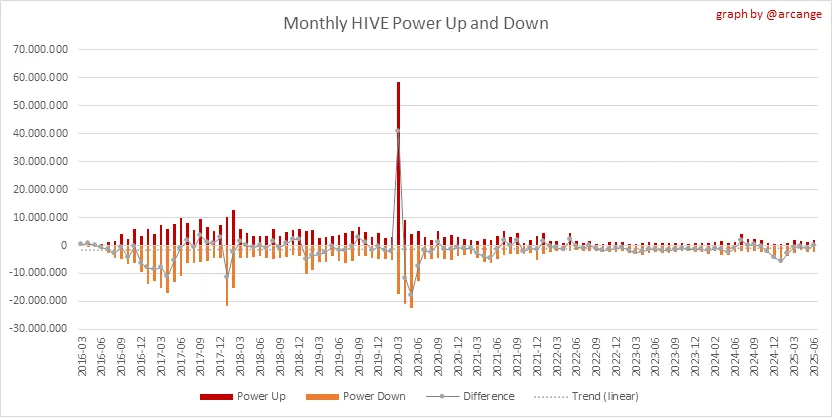
This graph shows the monthly HIVE power-up, power-down and the resulting variation.
Values for the last 3 months
| Period | Powerup | Powerdown | Difference |
|---|---|---|---|
| 2025-06 | 2,130,435.000 | 2,303,179.000 | -172,744.000 |
| 2025-05 | 1,246,581.000 | 2,457,065.000 | -1,210,484.000 |
| 2025-04 | 1,435,353.000 | 1,779,138.000 | -343,785.000 |
7. Transfers
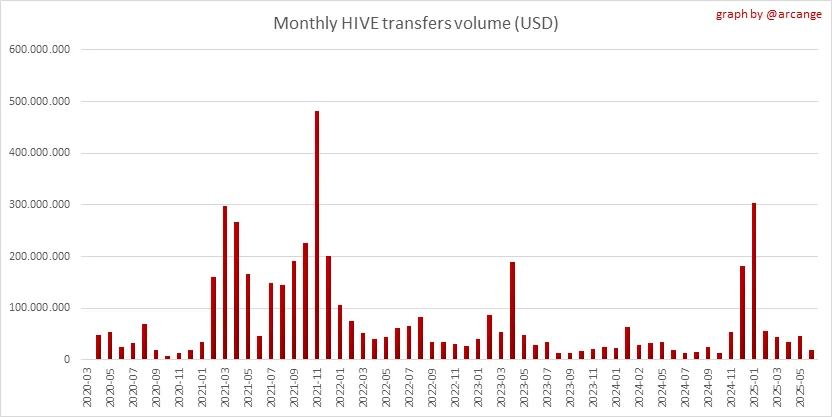 | 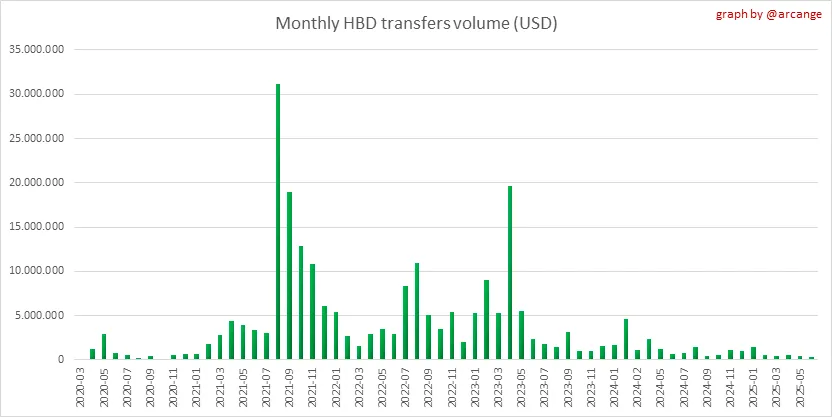 |
These graphs show the volume (in USD) of HIVE and HBD transferred between accounts.
8. Exchanges
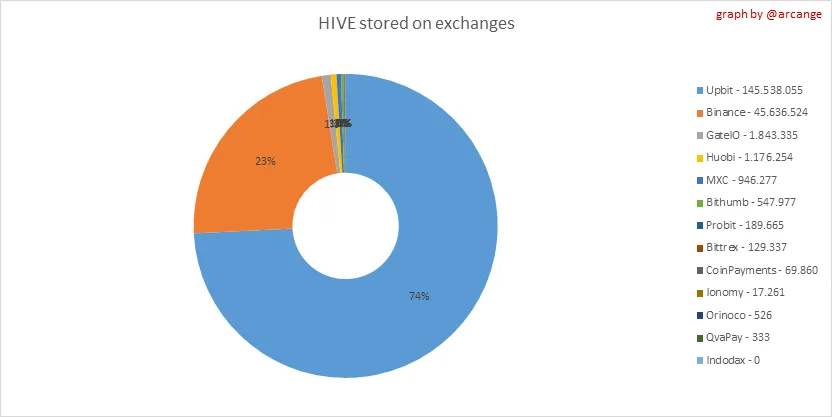 | 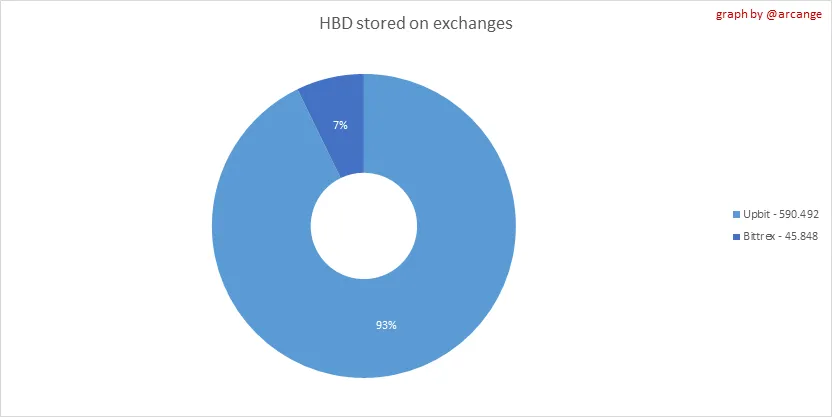 |
These graphs show the amount and distribution of HIVE and HBD stored on the exchanges where they are listed.
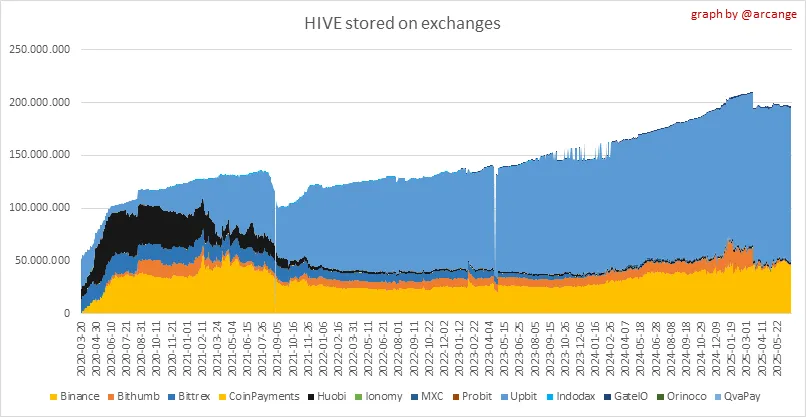 | 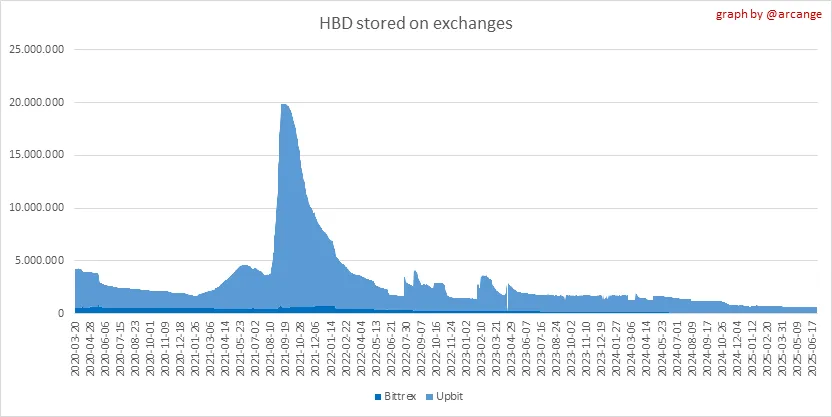 |
These graphs show the daily evolution of HIVE and HBD stored on the exchanges where they are listed.
I hope you find those stats useful. If you would like to see additional stats, feel free to drop me a comment. Your feedback is more than welcome.
Thanks for reading.
Check out my apps and services