
Introduction
Over the past few weeks, I stumbled upon a great way to access and analyze Hive blockchain data without needing to run my own node or deal with slow complex API calls. Enter HiveSQL—a powerful tool that lets you query Hive data like a pro!
In this blog, I'll walk you through the basics of setting up HiveSQL and using Python to extract useful data. If you've ever wanted to dive deeper into Hive's data, create custom analytics, or just explore what's happening on the blockchain, you're in the right place.
Prerequisites
Before we get started, you'll need:
✅ Some basic Python knowledge
✅ A HiveSQL account (I'll show you how to get one)
✅ A bit of patience for the setup—trust me, it’s worth it!
What is HiveSQL?
HiveSQL is a publicly available Microsoft SQL Server database that stores Hive blockchain data in a structured and easily accessible way. Instead of running your own Hive node or scraping data from public APIs, you can use SQL queries to quickly retrieve the information you need.
Why use HiveSQL?
✔ Faster queries – No need to download blockchain data manually
✔ Easy access – Works with any tool that can connect to an MS-SQL database
✔ Powerful analysis – Great for running reports, tracking trends, and finding valuable insights
Rather than making countless API calls, you simply send an SQL query to the HiveSQL server and get back exactly the data you need—fast and efficient!
➡ Support the HiveSQL proposal to keep it running for free!
HiveSQL Proposal - Keep It Free To Use For The Community
Setting Up a HiveSQL Account
To access HiveSQL, you’ll need an account. There’s a small one-time registration fee of 1 HBD to prevent spam.
Follow this guide to register:
🔗 HiveSQL Registration Guide
Preparing Your Machine (Windows)
If you're on Windows, you’ll need to install the ODBC driver to connect to HiveSQL.
Install the ODBC Driver
To perform SQL queries using Python, install the official Microsoft ODBC Driver 17 (18) for SQL Server (x64):
🔗 Download Here
➡For Other OS platform check out this link:
HiveSQL for Python developers
What is ODBC?
ODBC (Open Database Connectivity) is a standard way to connect applications (like Python) to databases (like HiveSQL). It acts as a bridge between your code and the database, allowing you to send SQL queries and receive results.
Installing Python Packages
Now that HiveSQL is set up, let’s install the necessary Python packages:
pip install pypyodbc pandas plotly
Here's what each package does:
📌 pypyodbc – Connects to the SQL Server and runs queries
📌 pandas – Handles large datasets efficiently
📌 plotly – Creates beautiful interactive charts
The setup process might seem a bit tedious, but you only have to do it once. Now comes the fun part—querying Hive data and visualizing it! Stay tuned for the next post, where we’ll start pulling real data from the blockchain! 🚀
Querying HiveSQL with Python
Now that we’ve set up HiveSQL, it’s time to write some Python code to pull data and visualize it. First, we need to set up a connection to the database and create a function that runs SQL queries and returns a pandas DataFrame. This will make it super easy to work with the data later.
Setting Up the SQL Connection
Before we start querying, let's set up a function to connect to HiveSQL and execute SQL queries. This function will:
✅ Establish a connection to the database
✅ Run a given SQL query
✅ Return the results as a pandas DataFrame
import logging
import pypyodbc
import pandas as pd

db_username = ""
db_password = ""

# Connection string using secrets
connection_string = f"""
    Driver={{ODBC Driver 17 for SQL Server}};
    Server=vip.hivesql.io;
    Database=DBHive;
    UID={db_username};
    PWD={db_password};
    TrustServerCertificate=yes;
    Encrypt=yes
"""

# Setup logger
log = logging.getLogger()

def execute_query_df(query):
    """
    Executes a SQL query and returns a Pandas DataFrame.

    Parameters:
    - query: str, the SQL query to execute.

    Returns:
    - pd.DataFrame with query results or an empty DataFrame if there's an error or no results.
    """
    connection = None
    try:
        # Setup connection
        connection = pypyodbc.connect(connection_string)
        cursor = connection.cursor()

        # Execute the query
        cursor.execute(query)

        # Fetch column names dynamically from the cursor description
        columns = [column[0] for column in cursor.description] if cursor.description else []

        # Fetch results
        result = cursor.fetchall()
        return pd.DataFrame(result, columns=columns) if result else pd.DataFrame(columns=columns)

    except pypyodbc.Error as e:
        log.error(f"Database error: {e}")
        return pd.DataFrame()  # Return an empty DataFrame on error

    finally:
        if connection:
            connection.close()
Now that we have our connection set up, let’s start running queries and visualizing the data! 🎉
Running a Query and Plotting a Graph
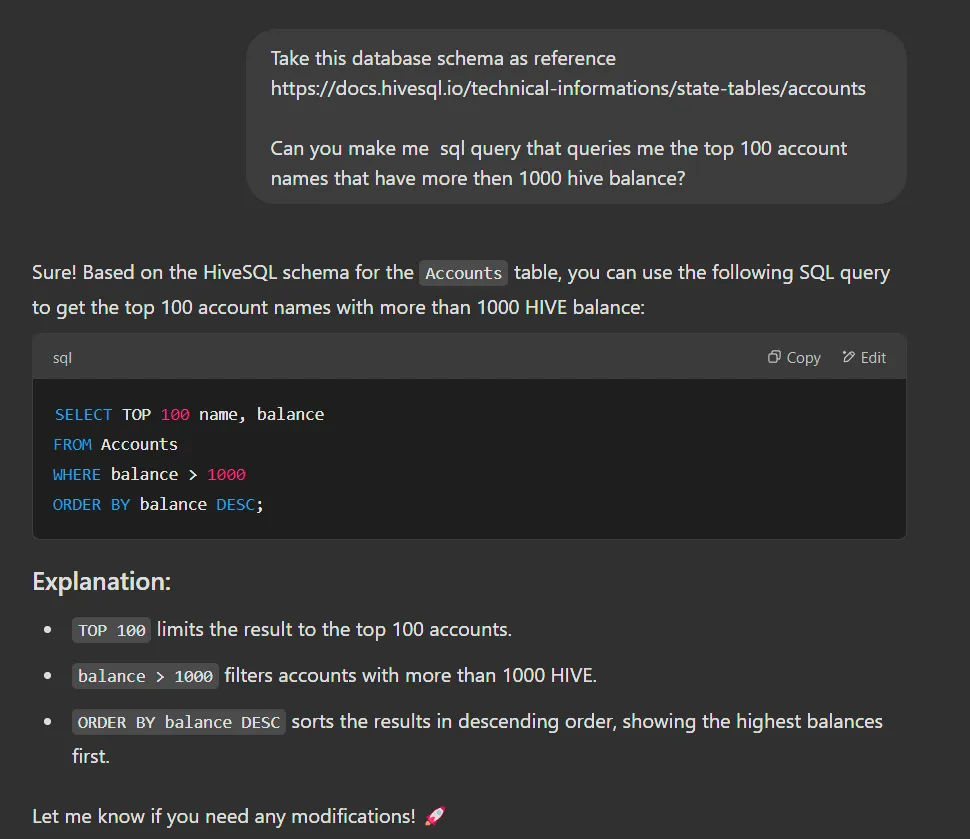
If you’re not familiar with SQL, don’t worry! You can always search online for SQL query examples, or just ask ChatGPT to help you. 😆
Let’s start with a simple query that pulls the top 100 accounts with the highest balances and plots them in a bar chart.
Moving It Into Python Code
Now let’s run this query and visualize the results using Plotly.
import plotly.express as px
if __name__ == "__main__":
df = execute_query_df("""
SELECT TOP 100 name, balance
FROM Accounts
WHERE balance > 1000
ORDER BY balance DESC;
""")
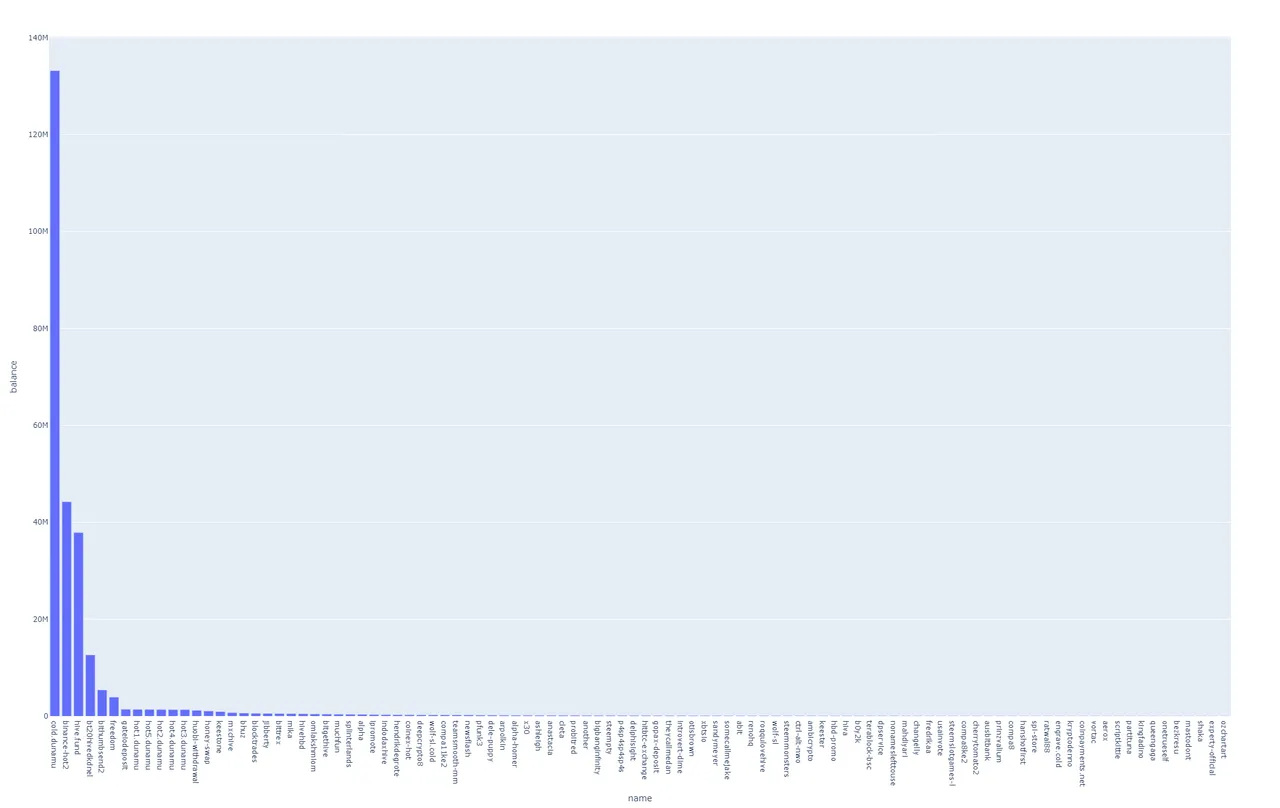
fig = px.bar(df, x='name', y='balance', title="Top 100 Hive Accounts by Balance")
fig.show()
And There You Have It—Your First HiveSQL Chart! 🚀
With just a few lines of code, we've queried HiveSQL and generated a bar chart of the top accounts by balance.
Why Use Plotly?
✔ Interactive charts – Hover over bars to see exact values
✔ Easy customization – Change colors, labels, and chart types
✔ Great for data analysis – Perfect for exploring Hive data
The possibilities are endless when it comes to what data you can query and visualize. Plotly allows you to tweak almost everything—axis labels, colors, chart types, and even animations!
Full Code
Here’s the full script in case you want to copy and paste it:
Click to expand full code
import logging
import pypyodbc
import pandas as pd
import plotly.express as px

db_username = ""
db_password = ""

# Connection string using secrets
connection_string = f"""
  Driver={{ODBC Driver 17 for SQL Server}};
  Server=vip.hivesql.io;
  Database=DBHive;
  UID={db_username};
  PWD={db_password};
  TrustServerCertificate=yes;
  Encrypt=yes
"""

# Setup logger
log = logging.getLogger()

def execute_query_df(query):
  """
  Executes a SQL query and returns a Pandas DataFrame.

  Parameters:
  - query: str, the SQL query to execute.

  Returns:
  - pd.DataFrame with query results or an empty DataFrame if there's an error or no results.
  """
  connection = None
  try:
      # Setup connection
      connection = pypyodbc.connect(connection_string)
      cursor = connection.cursor()

      # Execute Query
      cursor.execute(query)

      # Fetch column names dynamically from the cursor description
      columns = [column[0] for column in cursor.description] if cursor.description else []

      # Fetch results
      result = cursor.fetchall()
      return pd.DataFrame(result, columns=columns) if result else pd.DataFrame(columns=columns)

  except pypyodbc.Error as e:
      log.error(f"Database error: {e}")
      return pd.DataFrame()  # Return empty DataFrame on error

  finally:
      if connection:
          connection.close()

if __name__ == "__main__":
  df = execute_query_df("""
  SELECT TOP 100 name, balance
  FROM Accounts
  WHERE balance > 1000
  ORDER BY balance DESC;
  """)

  fig = px.bar(df, x='name', y='balance', title="Top 100 Hive Accounts by Balance")
  fig.show()
Final Thoughts
I know this is just the basics, and many Hive users in the community might already be familiar with these methods (or even have better ones!). But if you're new to HiveSQL, I hope this guide helps you get started!
If you’re interested in more advanced topics, let me know in the comments! 🚀 Some possible ideas for future blogs:
📌 More advanced SQL queries – Finding active users or trending posts
📌 Better visualizations – combining chart and updating layouts
📌 Deploying a live app – Making an interactive Hive data dashboard
Let me know what you’d like to see next! As always, feedback is welcome, and I hope you enjoyed this post. 😃