How many active accounts does the Hive blockchain have in 2025? What are they doing on chain, posting, gaming, transferring funds?
The Hive blockchains have around 2.6M. What percentage of these accounts are active?
How has the market influenced the number of active accounts?
Let’s take a look!

Top Four Hive Operations
We will be looking at the activity on the chain by the top operations made:
- Post and comment
- Votes/Curate
- Transfer coins
- Custom JSON transactions
Apart from the above, reading, or page views, is also a crucial part of this ecosystem, but this type of operation is not stored on the blockchain.
We will be looking at the number of active accounts by the operations stated above for the 2020 – 2024 period.
We will be looking at the number of DAUs (daily active users), the number of MAUs (monthly active users), and then summary for the whole year.
Daily Number of Active Accounts
First let’s take a look at the number of accounts active per day. Here is the chart.
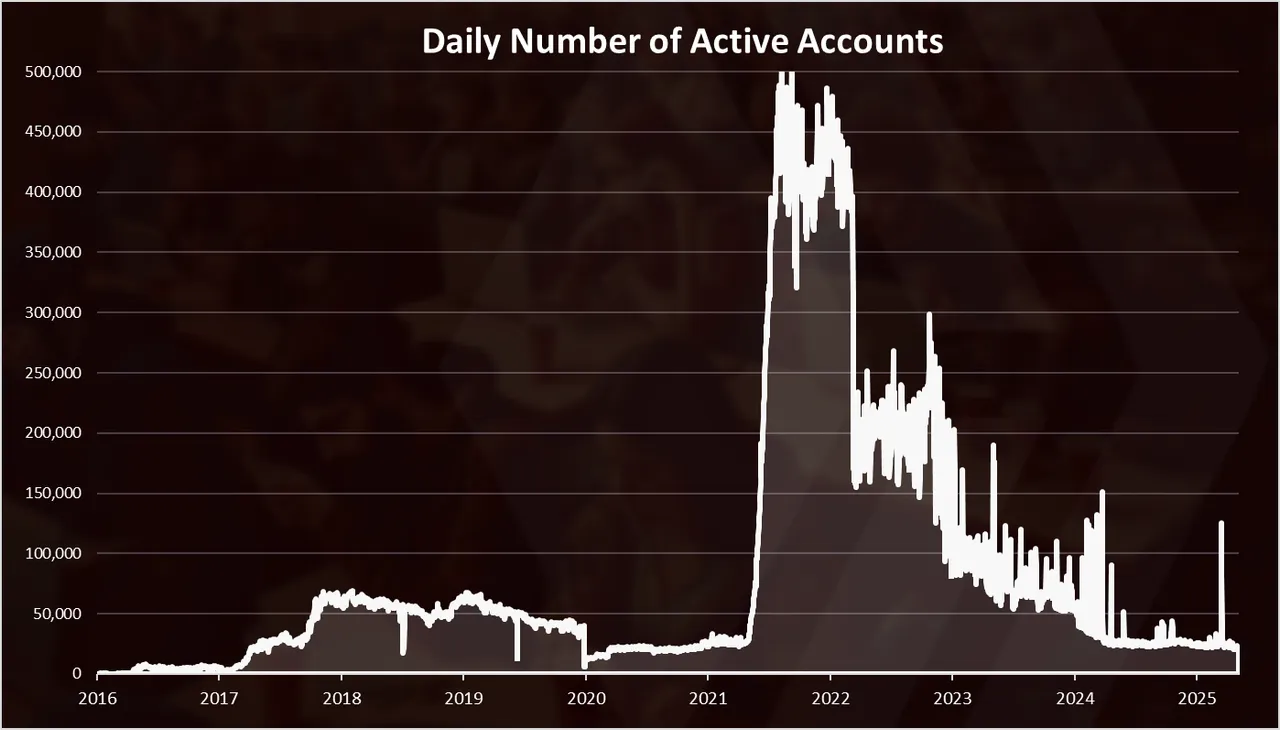
The above is the chart for DAUs, for accounts making any type of operation, way back from 2016.
As we can see the first spike in active accounts was back in 2017 and 2018, when the active accounts reached around 60k per day, then a subsequential drop in 2019 and 2020. In 2020 there is a sharp drop after the Hive hardfork in March 2020 down to around 10k, from the previous 30k.
An explosion in the number of DAUs in 2021, due to the increase in activity by Splinterlands, reaching an ATH close to *500k DAUs.
A sharp pullback in the following years and we are now around 22k DAUs, a number that has been quite constant in the last year.
When we zoom in 2024-2025 we get this:
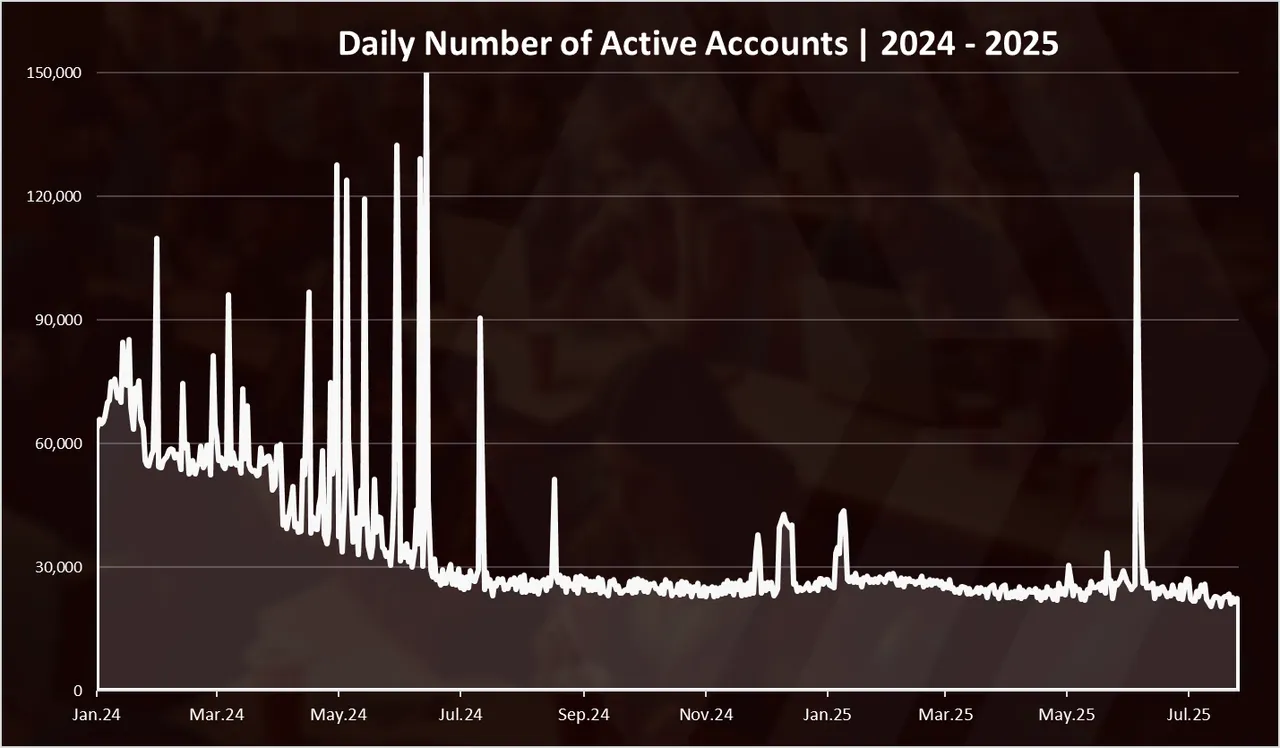
At the beginning of 2024 there was around 60k DAUs, then a drop going in the summer of 2024 to around 28k, and since then almost constant with a small drop to around 22k in the last period. The spikes and the volatility is mostly caused by the activity of the Splinterlands players.
Further below we will break down the DAUs by activity type where this will be clearer.
Active Accounts by Category
What type of operations are these accounts making?
From previous analysis we know that most of the DAUs come from Splinterlands. If we take a look at a chart with active accounts per operation, we get this:
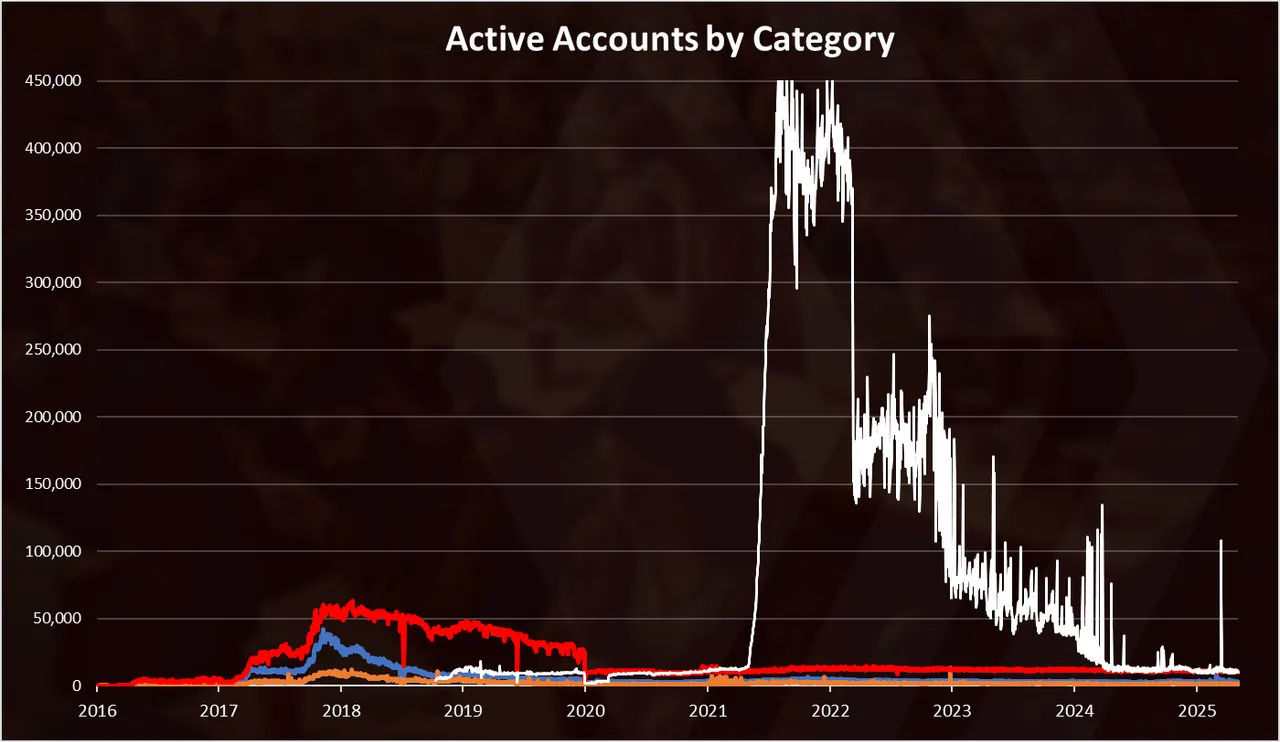
Legend:
- White, number of accounts making custom_json operations (mostly Splinterlands)
- Red, number of accounts voting
- Blue, number of accounts posting
- Orange, number of accounts transferring tokens HIVE/HBD
As we can see in the first stage of the Hive chain, prior to 2021, most of the accounts were posting and curating/voting. The highest numbers of DAUs was for the curation part, with close to 60k accounts per day, curating back in 2017 and 2028. The number of accounts posting was a bit smaller and at the ATH at the end of 2017 was close to 50k. After the Hive hardfork the numbers went down.
Things changed a lot in 2021 when the number of accounts making custom_json operation exploded mostly becouse of the activity on Splinterlands. We can notice that at the same period, the number of the accounts making other activities was quite constant and didn’t have a spike like in the previous cycle.
If we zoom in 2024-2025 we get this:
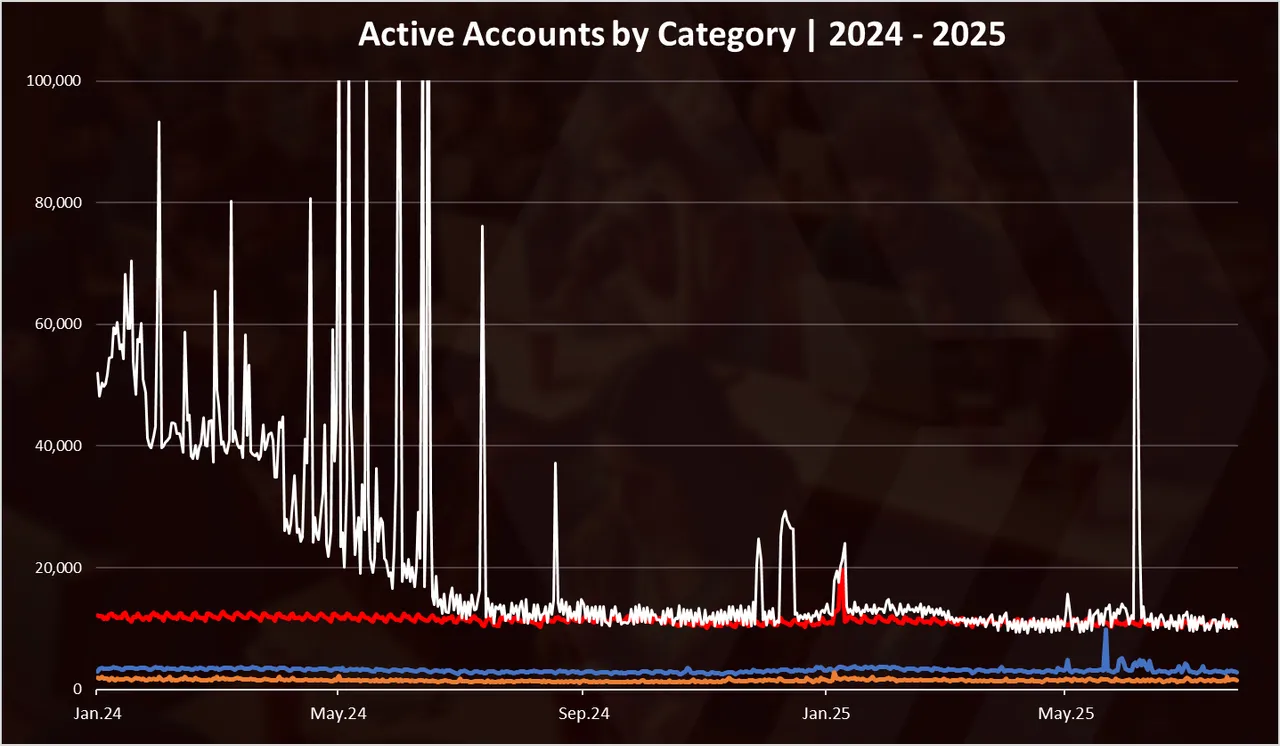
This is a period where we have more stable numbers. We can see that the custom JSON accounts are now close to the voting/curating accounts both with around 13k daily. The number of accounts posting daily is around 3.3k and accounts making transfers around 1.6k.
Active Accounts Posting or Commenting
If we focus only on the core activity so to speak, the chart for accounts making post or comments looks like this:
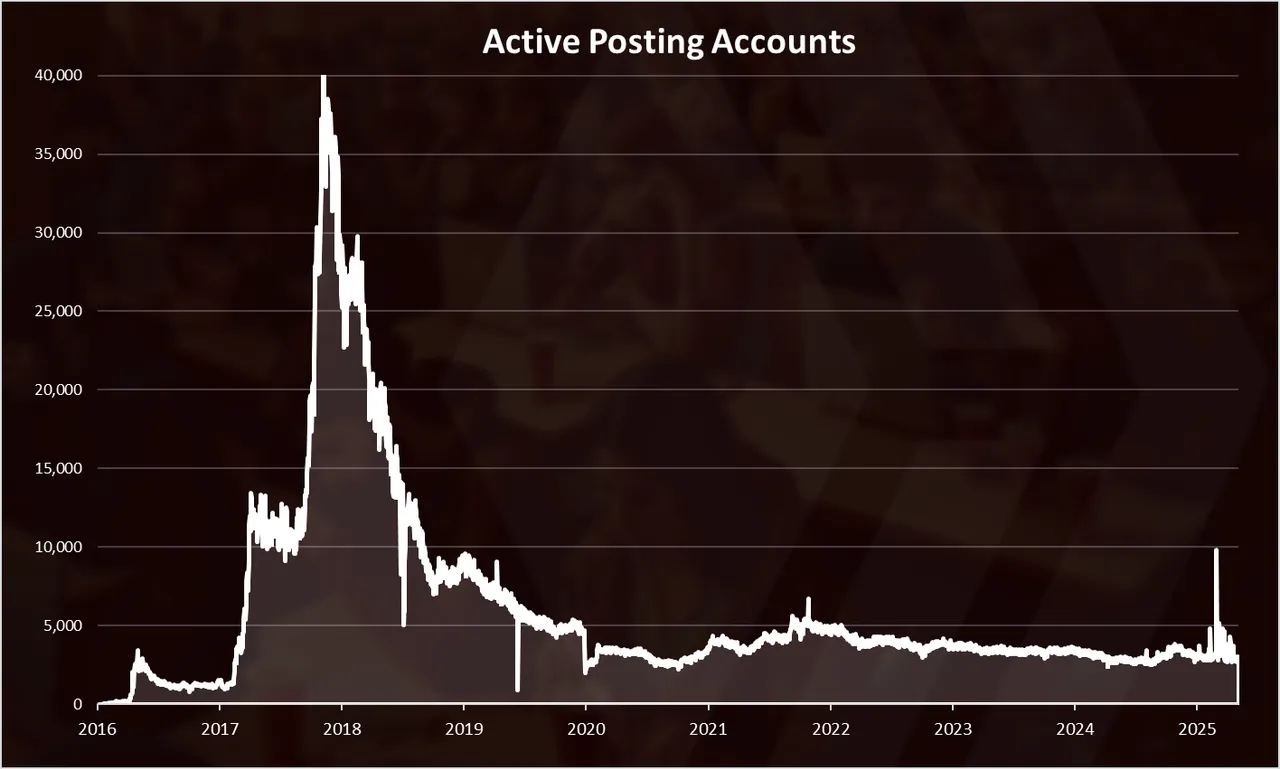
This chart is also from the very beginning back in 2016 We can notice that the absolute height for accounts posting was reached at the end of 2017 when there was a total of 43k posting per day. At this point the price of Hive, back them Steem was reaching a massive 7$ or 8$.
As the price plummented so does the posting activity in 2018 and 2019. There was a small increase in the bull run of 2021 from 3k up to 6k DAUs posting, and a slow decline since then to around 3k active accounts. There was a spike recently, but that was probably some automation firing up.
When we zoom in 2024 – 2025 we get this:
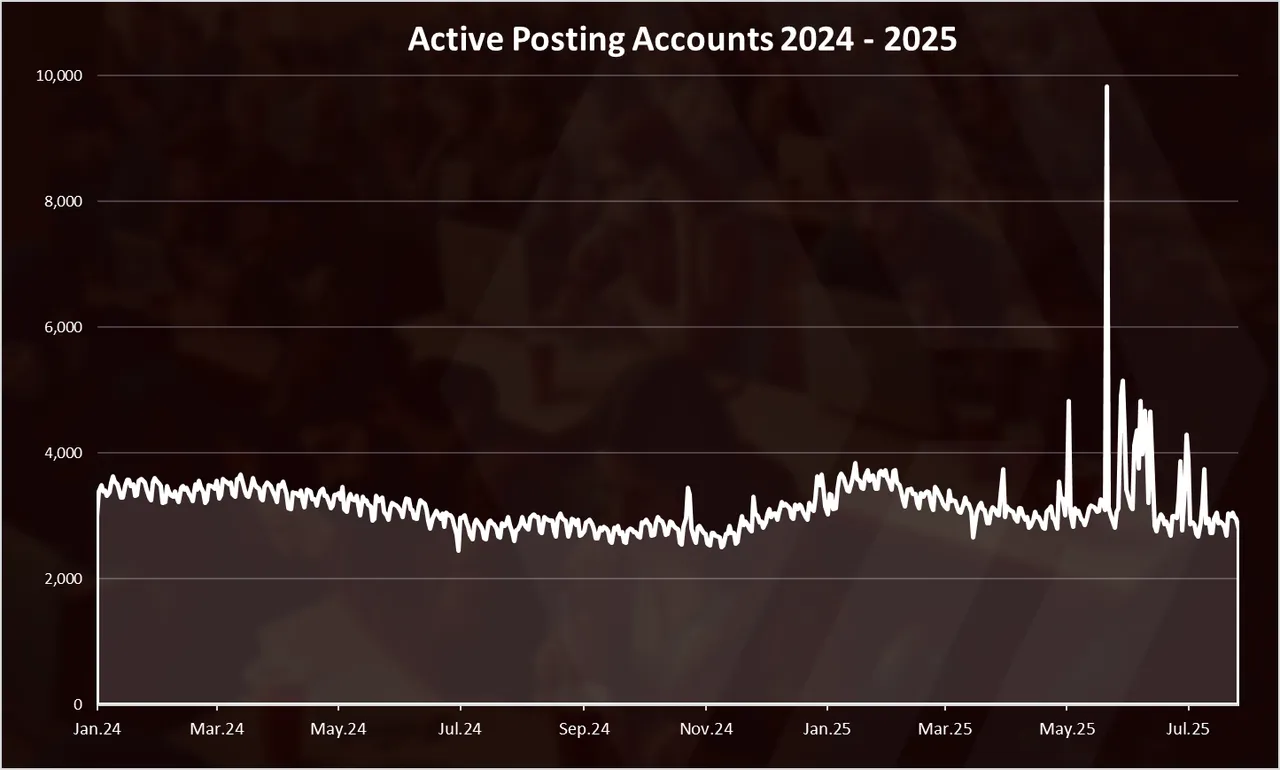
Here we can notice a very stable period for accounts posting. The numbers in general are between 3k to 3.5k, with the recent spike back in May. There is a slight increase in January 2025, when the price of Hive increased as well. Overall, the price still affects the DAUs, but with much less volatility.
Monthly Number of Active Accounts
The monthly numbers might give a better perspective on active accounts, as not all the users are making operations daily. Here is the chart.
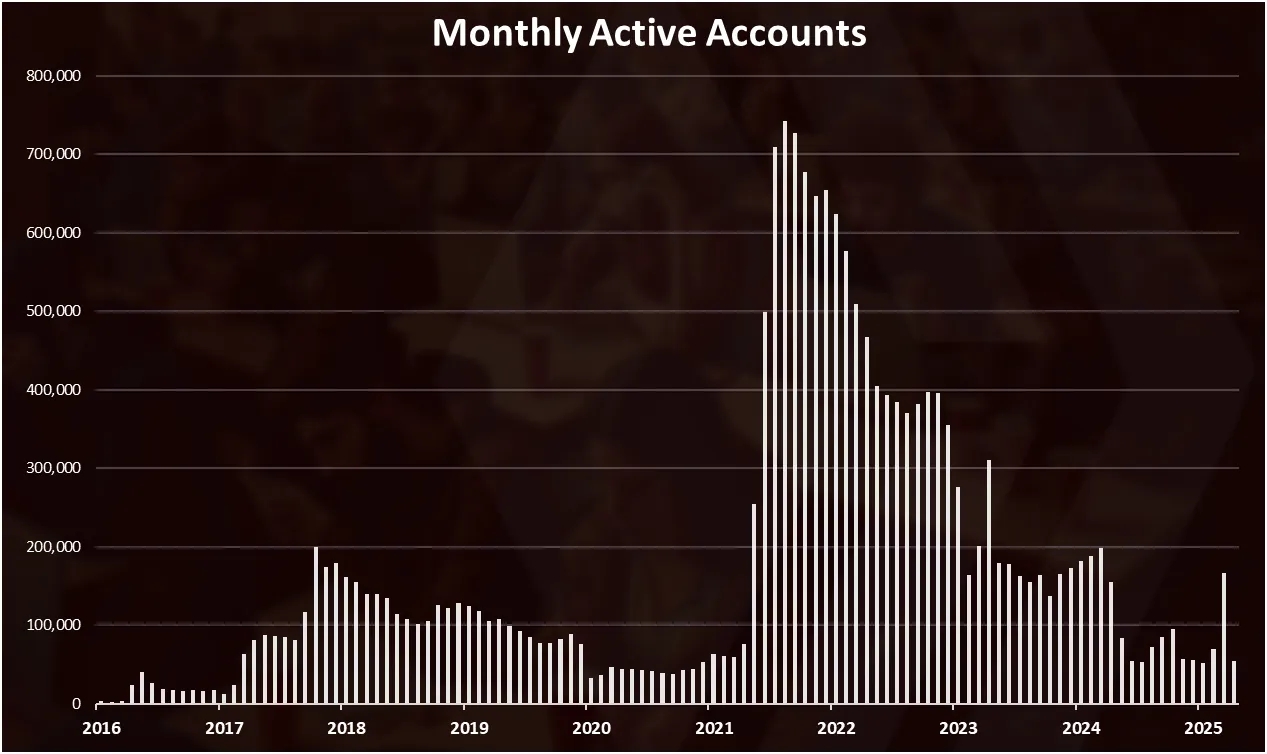
We can see the sharp increase in the MAUs back in 2021. From around 50k to more than 700k in a few months. After the peak at the end of 2021, the number of MAUs has steadily been going down.
The lows were in the summer of 2024, then a growth toward the end of the year.
Again these strong oscillations are driven from the Splinterlands activity.
When we zoom in 2024-2025 for MAUs we get this:
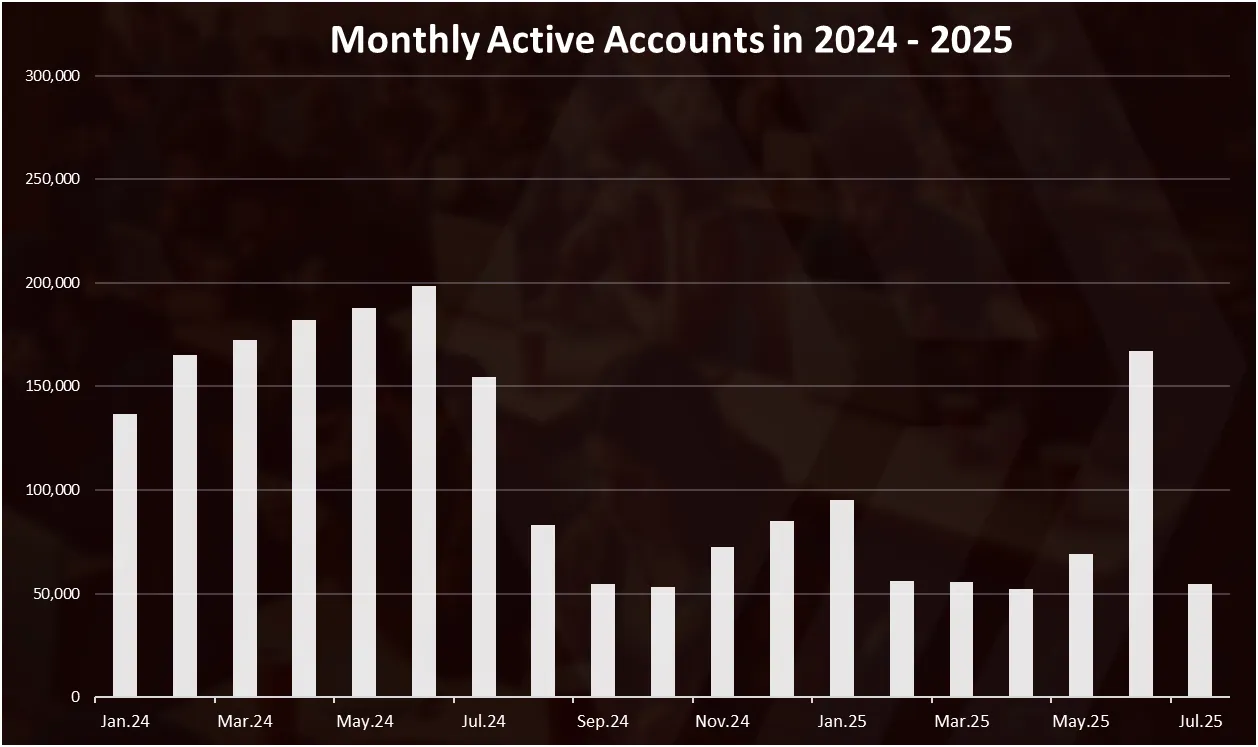
We can notice a growth in the first half of 2024 then a drop towards the summer of 2024 from 200k to 50k. This is again mostly driven by Splinterlands. A growth again towards the end of 2024 and January 2025 to 100k, and a drop again to a 50k. There was a spike in June 2025 to 170k, and a drop in July to around 55k MAUs. Overall we can say that in 2025 the MAUs have been in the range of 50k to 60k.
Monthly Active Accounts per Category
When we breakdown the monthly active accounts by type of operation we get this:

As for the DAUs, we can see that the custom JSON operations have the highest volatility.
In the first cycle of 2017 the dominant operation was the voting (grey) when at the ATH there was 180k MAUs for voting, while the posting was around 140k MAUs. We can see the custom_json operations starting to increase in 2018, this was around the time Splinterlands was launched. Then a massive spike in 2021 up to 700k MAUs for custom_json operations, while the other ones remain low. A drop in the following years.
When we zoom in 2024-2025 we get this:
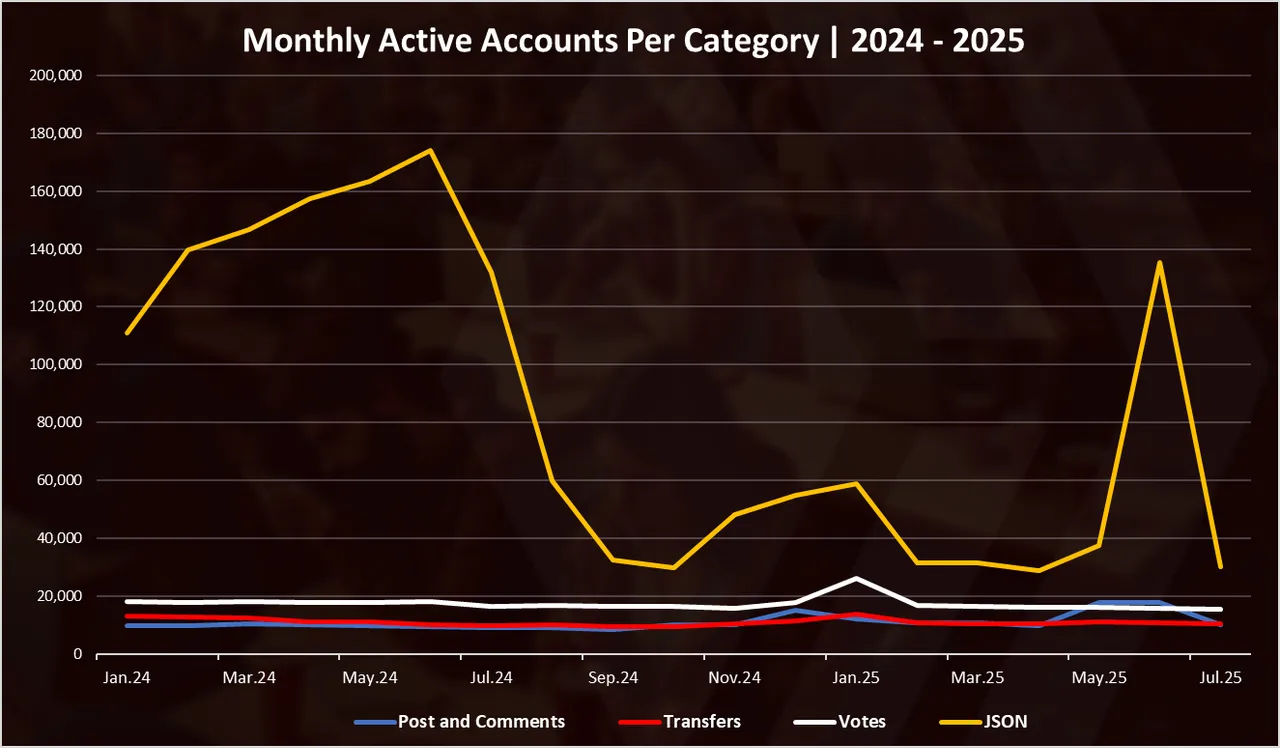
Here we can notice that the custom_json operations are still dominant on a monthly basis, but not as much as before. In 2024 there was up to 180k MAUs for the custom_json operations, while the other MAUs are in the range of 10k to 20k. There was a spike in the activity in June, maybe because of the presale in Splinterlands and drop again afterwards. The MAUs for custom_json on average have been around 50k in 2025, while for the other operations in the range of 15k to 20k.
Posting Monthly Active Accounts
How is the core activity, posting or commenting doing in terms of MAUs. Here is the chart.
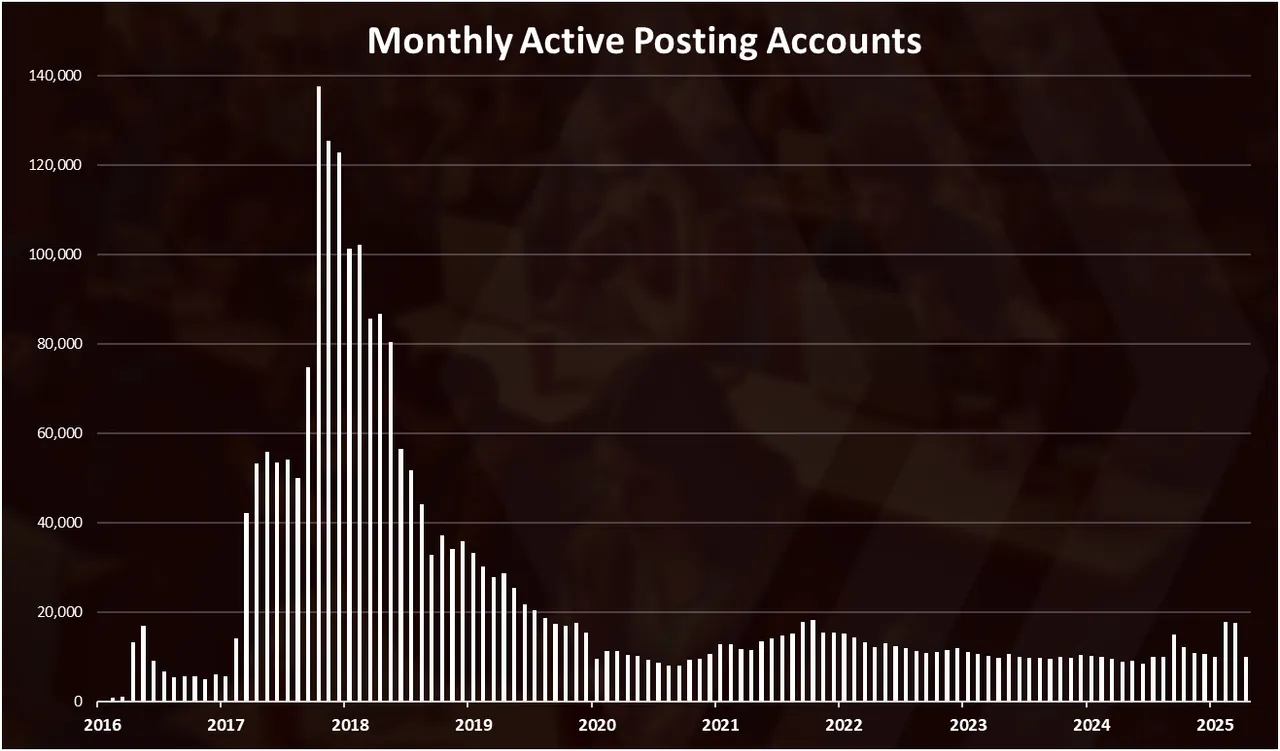
In terms of posting, as for the DAUs we can notice that the heights were reached back in 2017 with close to 140k MAUs. A drop since then down to 8k at the start of 2020, then a moderate growth in 2021 close to 20k, and then a drop again in the range od 10k to 15k.
There has been a spike in May and June 2025, but overall in 2025 the data is in the range from 10k to 12k MAUS.
For the last two years the chart looks like this:
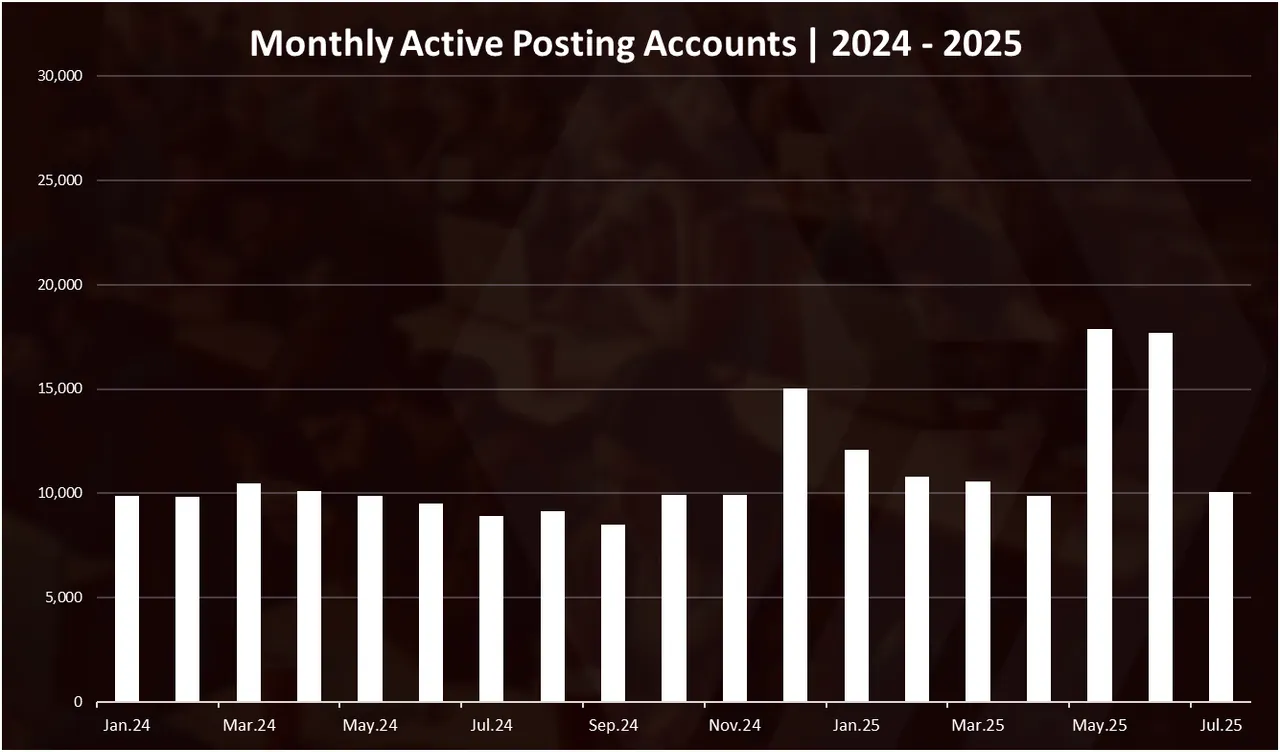
Quite a steady number around the 10k, with some occasional spikes.
Active Hive Accounts by Category in July 2025
For July, the number of MAUs, summarized by categories looks like this.
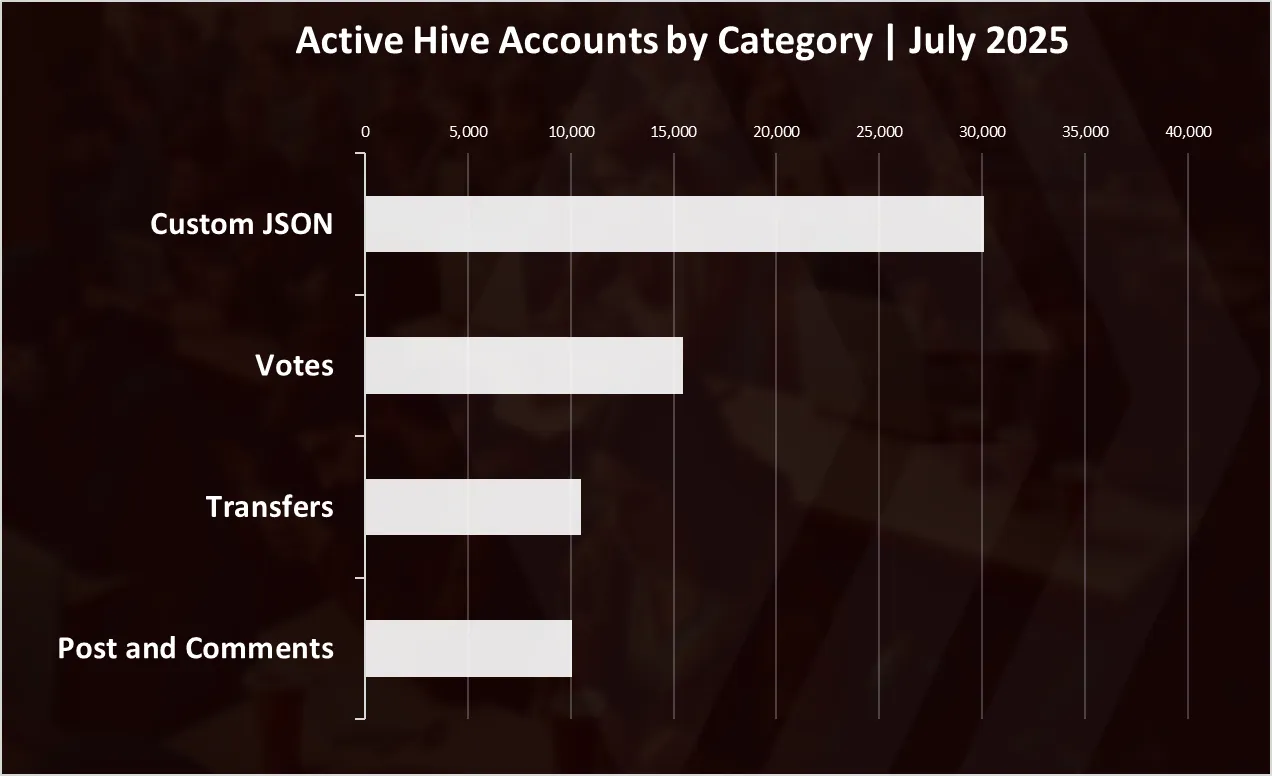
Number of active accounts in July 2025 by operation:
- Custom JSON - 30k
- Votes – 15k
- Transfers – 10.2k
- Post and Comments – 10.1k
Gaming is on the top, in the second spot with 16k is curation/votes, then comes transfers and posting comes at the end.
Overall we can notice two ways in the increase in the active accounts. The first one back in 2017, when the increase in the active users was driven mainly by posting and reached 70k DAUs and 200k MAUs, and another one in 2021, that was driven by the custom_json operations, that surpassed the previous cycle with 500k DAUs and 700k MAUs.
In the last period the numbers have been in the range of 20k to 30k DAUs and 100k to 200k MAUs.
Live data for cumulative DAUs here:
https://hbdstats.com/hive.html
All the best
@dalz