The Hive blockchains has around 2.5M.
What percentage of these accounts are active? How many active accounts the Hive blockchain has and how are they transacting/using on the blockchain?
How is the bear market influencing the number of active accounts?
Let’s take a look!

Top Four Hive Operations
We will be looking at the activity on the chain by the top operations made:
- Post and comment
- Votes/Curate
- Transfer coins
- Custom JSON transactions
Apart from the above, reading, or page views, is also a crucial part of this ecosystem, but this type of operation is not stored on the blockchain.
We will be looking at the number of active accounts by the operations stated above for the 2022 – 2023 period.
We will be looking at the number of DAUs (daily active users), the number of MAUs (monthly active users), and then summary for the whole year.
Daily Number of Active Accounts
First let’s take a look at the number of accounts active per day. Here is the chart.
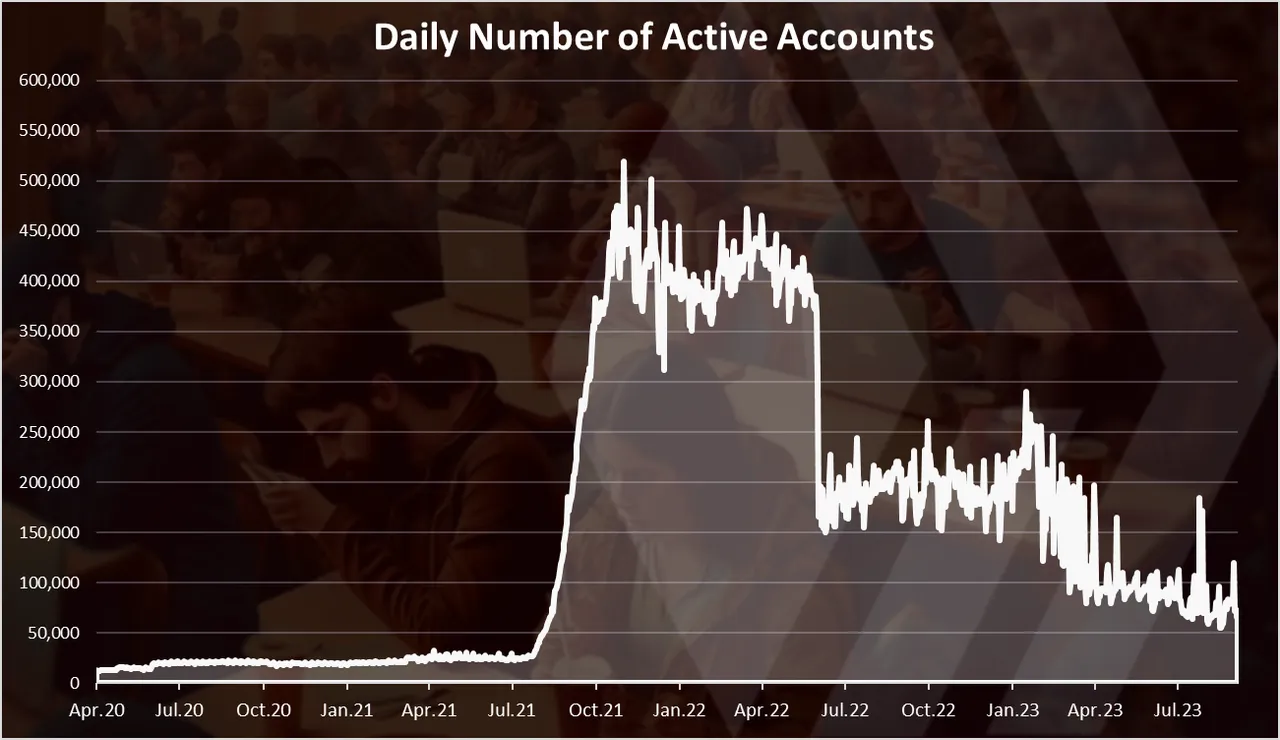
The above is the chart for DAUs, for accounts making any type of operation.
This chart is from the Hive creation fork, back from March 2020. As we can see at first in 2020 the number of DAUs was low with around 15k to 20k accounts making any type of operation on the Hive blockchain daily.
Then in the summer of 2021 this number increased significantly driven by the success of Splinterlands. At one point the DAUS reached 500k per day. In 2022 the DAUs numbers were around 200k, and in 2023 this number continued to goes down and we are now somewhere around 85k DAUs per day.
Most of these movements are due to Splinterlands active players.
Active Accounts by Category
What type of operations are these accounts making?
From previous analysis we know that most of the DAUs are coming from Splinterlands. If we take a look at a chart with active accounts per operation, we got this:
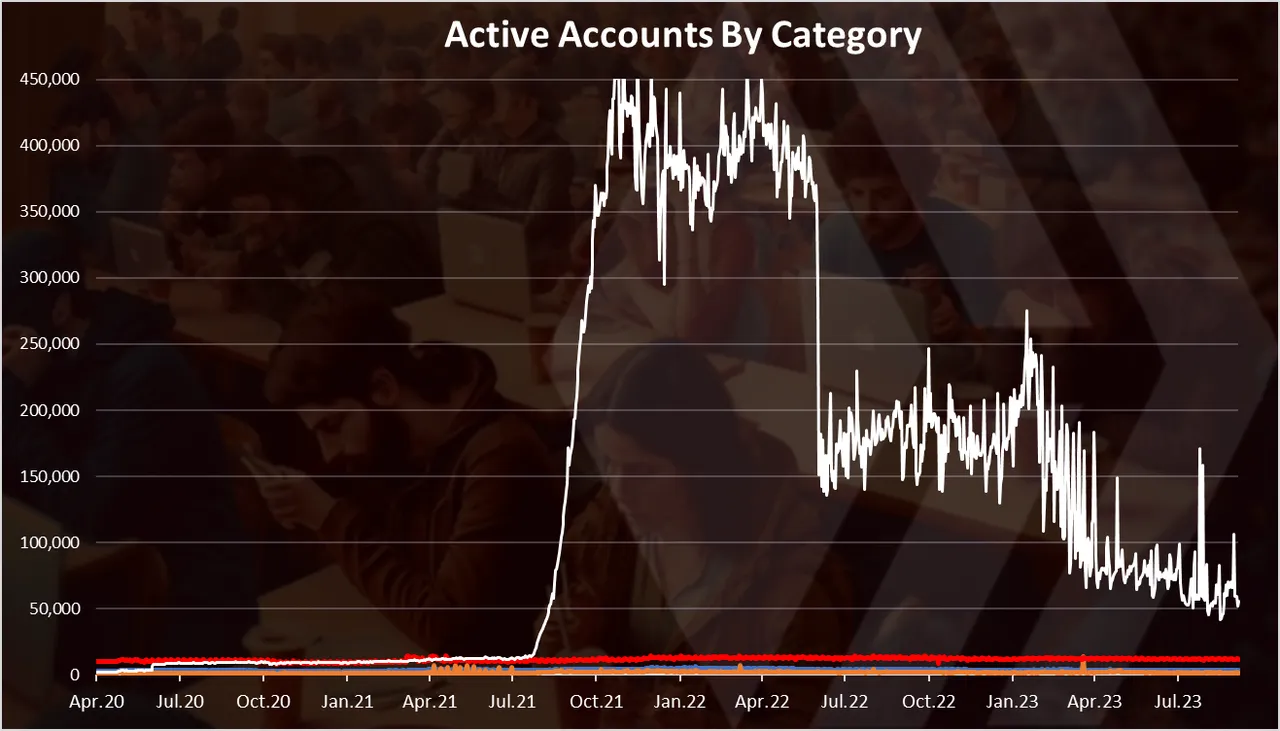
The top line are the accounts making custom JSON operations, that in most cases are Splinterlands operations. The number of these accounts is so much higher then the rest of the operations that we can barely see them on the bottom of the chart.
The number of daily accounts making custom json operations is the last period is around 65k.
If we exclude the accounts making custom json operations for better visibility, we get this:
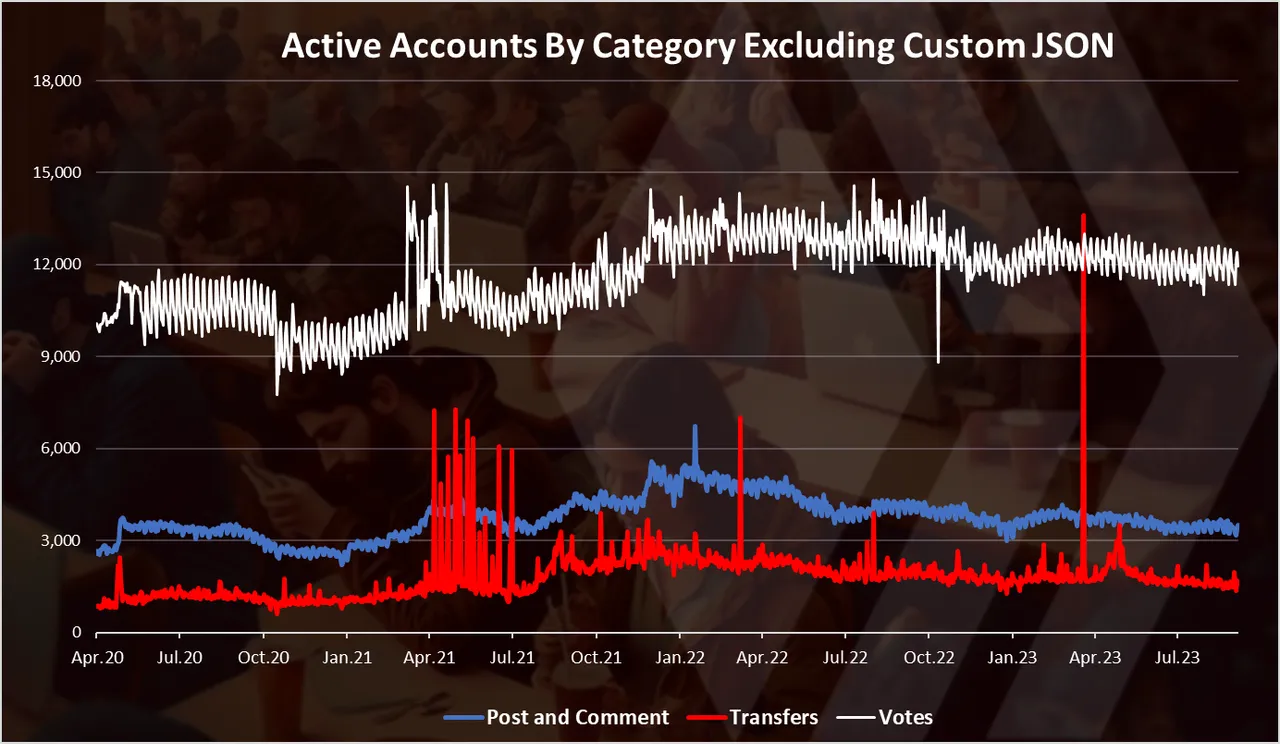
These numbers are quite stable.
From the above we can see that in the last period there is around 12k accounts voting/curation on daily basis, then there is around 3.5k accounts making posts or comments, and around 2k accounts transferring funds.
Its interesting to see tat there has been some spikes in the numbers of active accounts that are transferring HIVE around.
We can notice a slight downtrend in the number of these operations, but no significant drop, compared to the prices.
Active Accounts Posting or Commenting
If we focus only on the core activity so to speak, the chart for accounts making post or comments looks like this:
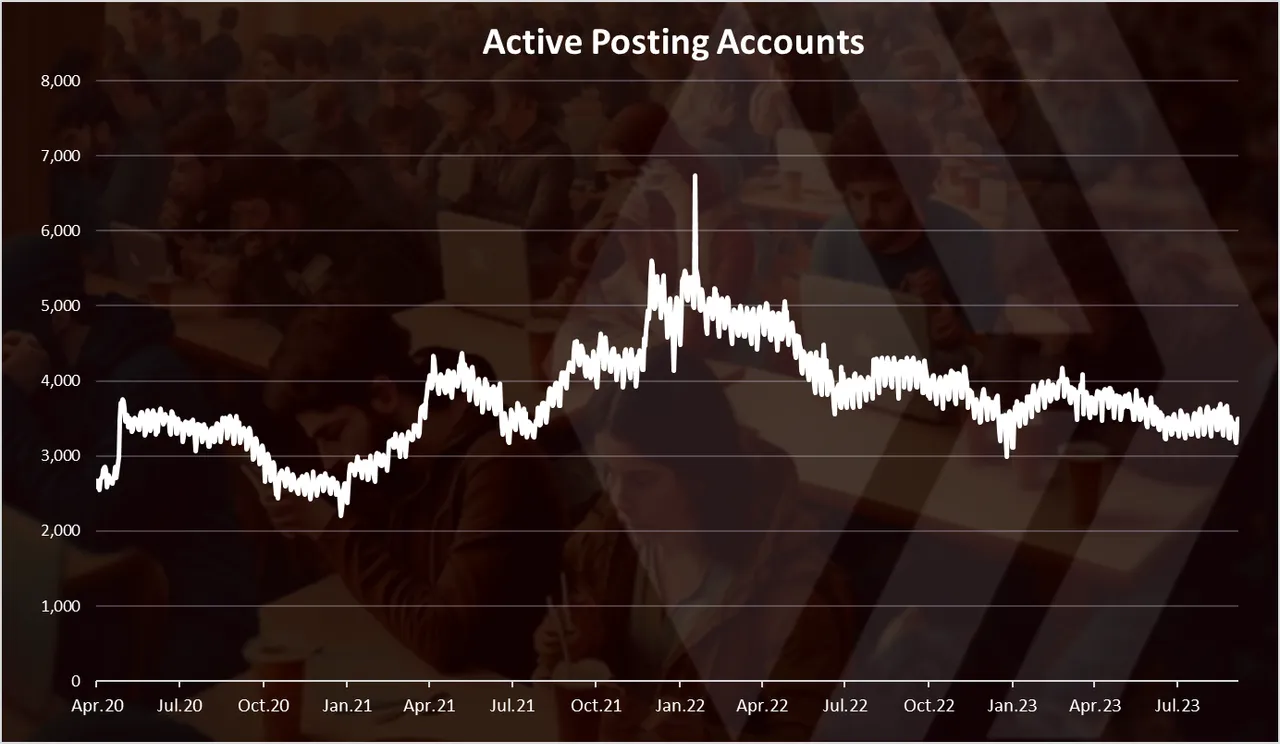
We can notice the uptrend until January 2022, and then a steady downtrend since then. At the top there were around 5.5k accounts making post or comment daily. Now we are at 3.5k DAUs, back around the level where we were in 2020. The drop in the number of posting and commenting accounts is much smaller compared to the overall activity.
Monthly Number of Active Accounts
The monthly numbers might give a better perspective for active accounts, as not all the users are making operations daily. Here is the chart.
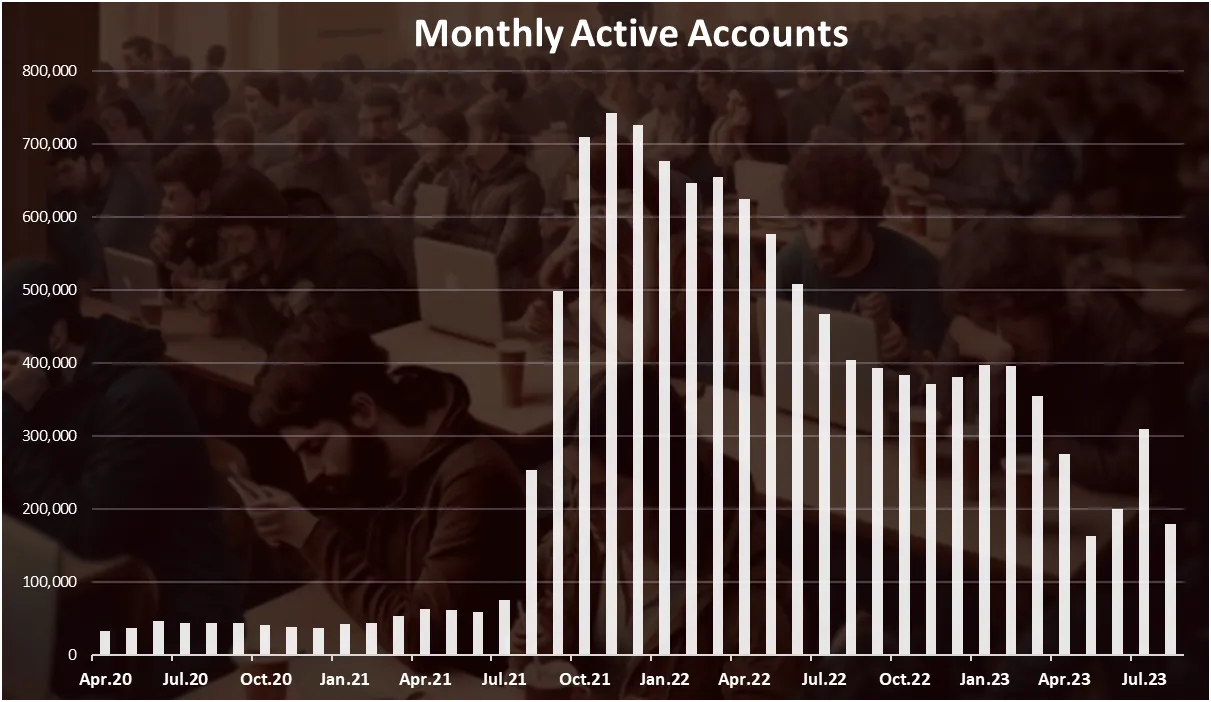
We can see the sharp increase in the MAUs back in 2021. From around 50k to more than 700k in a few months. After the peak at the end of 2021, the number of MAUs has steadily been going down, and we are now at 180k MAUs in August 2023. Note again that most of this movements are due to Splinterlands.
When we breakdown the monthly active accounts by type of operation we get this:
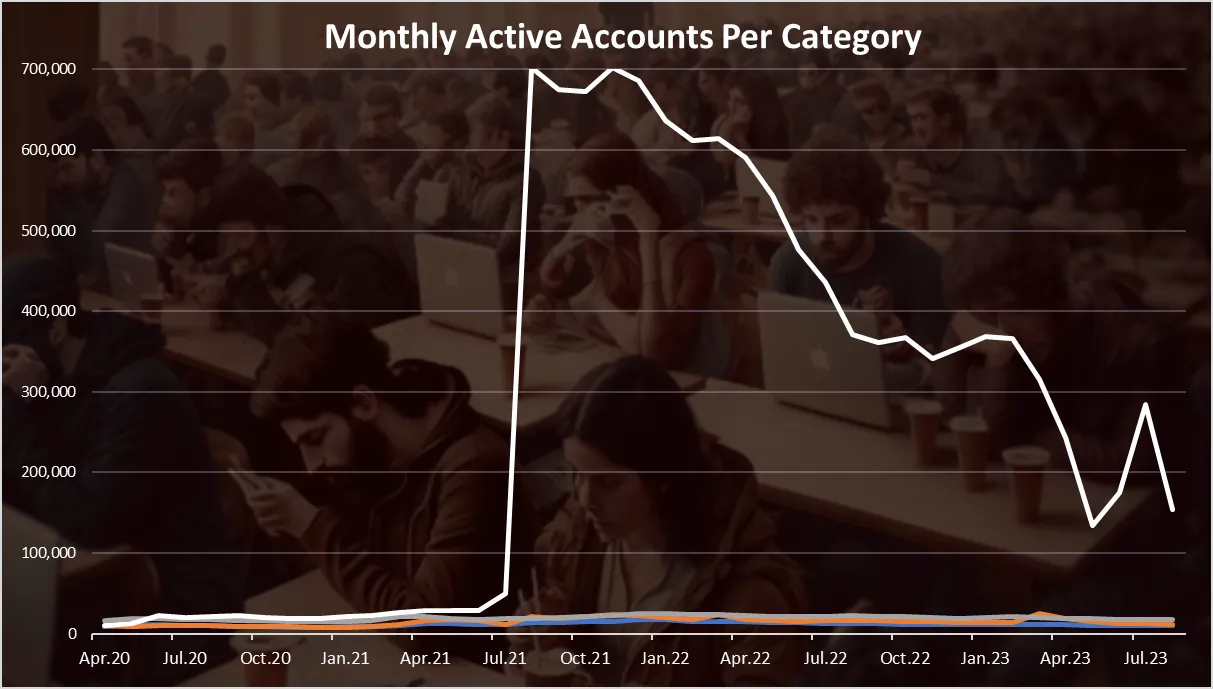
As for the DAUs, we can see that the custom JSON operations dominate this chart as well.
Back in 2021 there were 700k accounts making custom json operations while now we are at 150k MAUs.
If we zoom in for the other three categories, excluding the custom_json , we get this:
A much steadier numbers here, with a slow growth towards January 2022, and then a slow decline. The number of accounts voting is on the top in terms of MAUs, with 18k in the last month, followed by the accounts transferring funds, with 12k, and then closely next are the MAUs for accounts posting or commenting with 10.5k.
Active Hive Accounts by Category in August 2023
For the month of August 2023, the number of MAUs, summarized by categories looks like this.
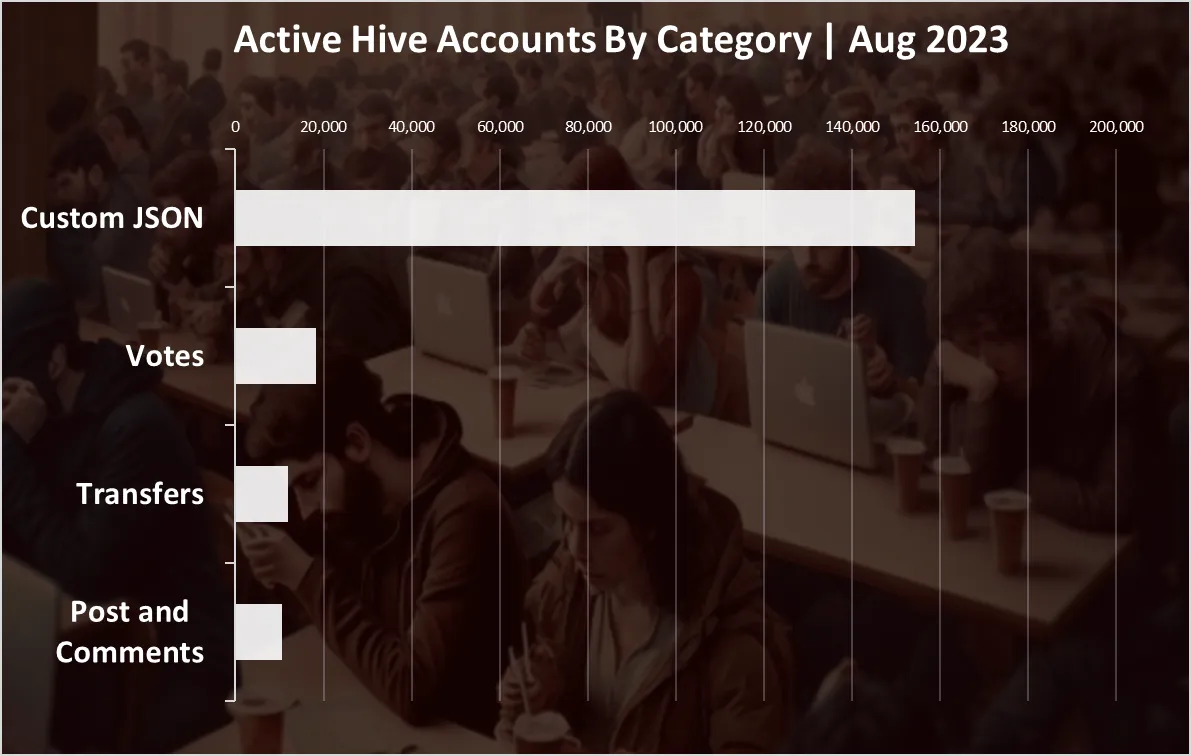
Number of active accounts in 2023 by operation:
- Custom JSON - 154k
- Votes – 18k
- Transfers – 12k
- Post and Comments – 11K
In total there is 180k accounts making some type of operation in August 2023 on the Hive blockchain.
What’s interesting is the number of accounts transferring coins is on the second spot here. Curation/votes are next and posting comes at the end.
Overall, we can see that the gaming side of the Hive blockchain has been led by Splinterlands and has taken over the number of DAUs and MAUs, but the numbers have been volatile. The number of accounts posting, commenting, voting has been much steadier in the last three years, with a slow increase during the bull and a slow decline since then.
All the best
@dalz