Hive is known for free transactions!
With the Hardfork in October 2022, RCs were separated from HP, and this enabled even better management of the resource credits system and the feeless transactions.
In the past years games and especially Splinterlands have taken advantage of this and increased their product and users.
How are we doing these days in terms of transactions?

Usually when talking about activity on the Hive blockchain a lot of the users have in mind posting and commenting. Here we will be looking at the top activities on the blockchain:
- Posts and Comments
- Votes
- Transfers
- Custom JSON operations
The above consists of the majority of all the transactions on the blockchain.
Daily Number of Total Transactions on Hive
Before we jump into the breakdown of the different types of transactions first lets take a look at the overall number of transactions.
Here is the chart.
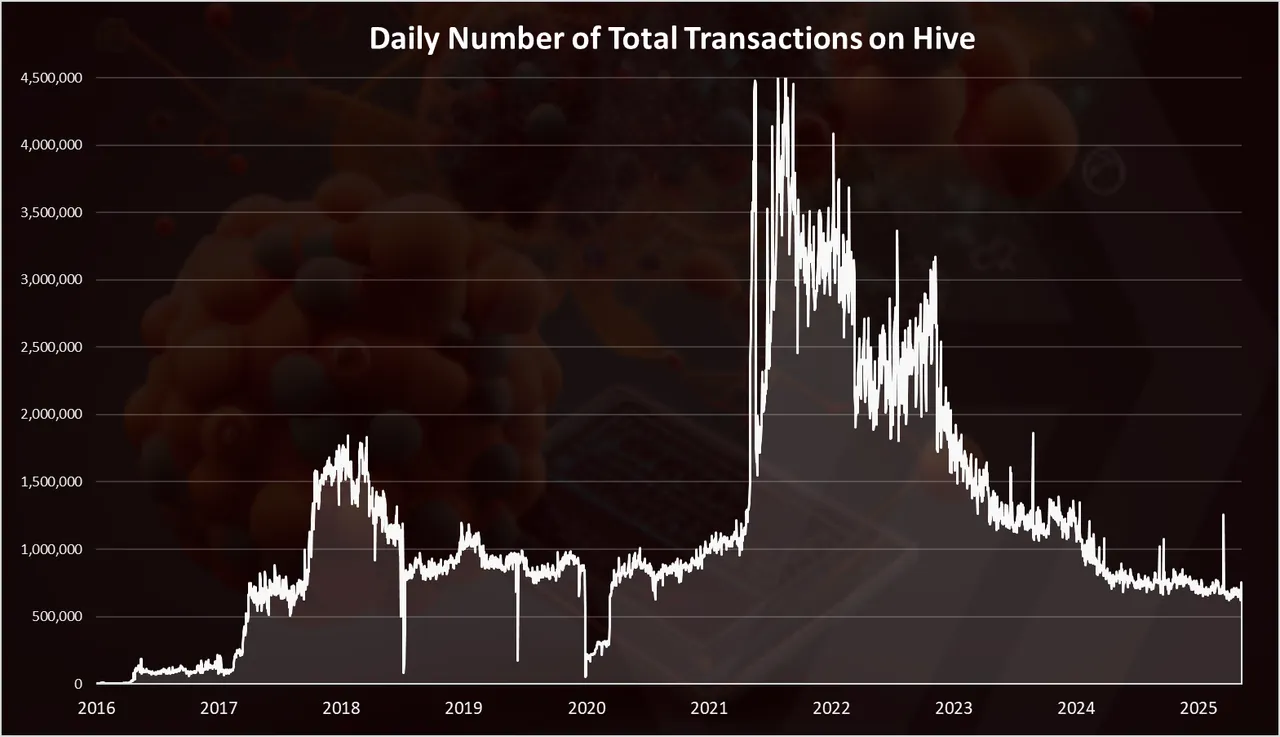
The data here is way back from 2016. We can notice the jump back in 2017 in the first bull run reaching close to 2M transactions per day, and then again even more massive one in 2021 when on occasions there were 5M daily transactions. The second wave was mostly driven by Splinterlands while in the first bull run the activity was mostly caused by posting.
A drop since then and in the last year we are around 700k.
Daily Number of Total Transactions by Category
When we break down the activity by category we get this:
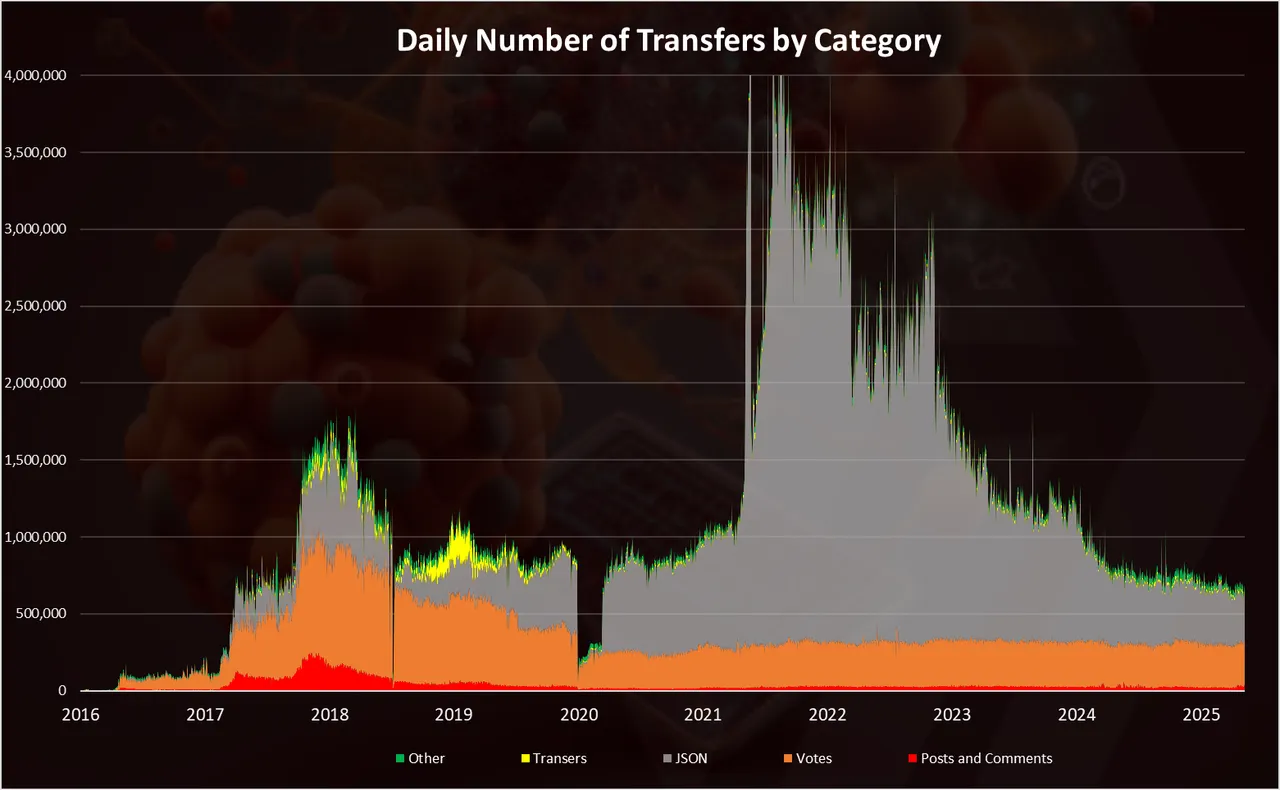
Here we can see that the activity is dominated by the custom json (grey) and the votes (orange) operations. The posting operations are with red on the bottom of the chart. We can see that the custom_json operation exploded in 2021 and dropped since then and are now almost on pair with the votes with around 300k each.
Note that there is a difference between the weight of this operations, since voting and custom_json is just a click of the button operation, while posting in most of the cases requires much more effort.
When we zoom in 2024-2025 we get this:
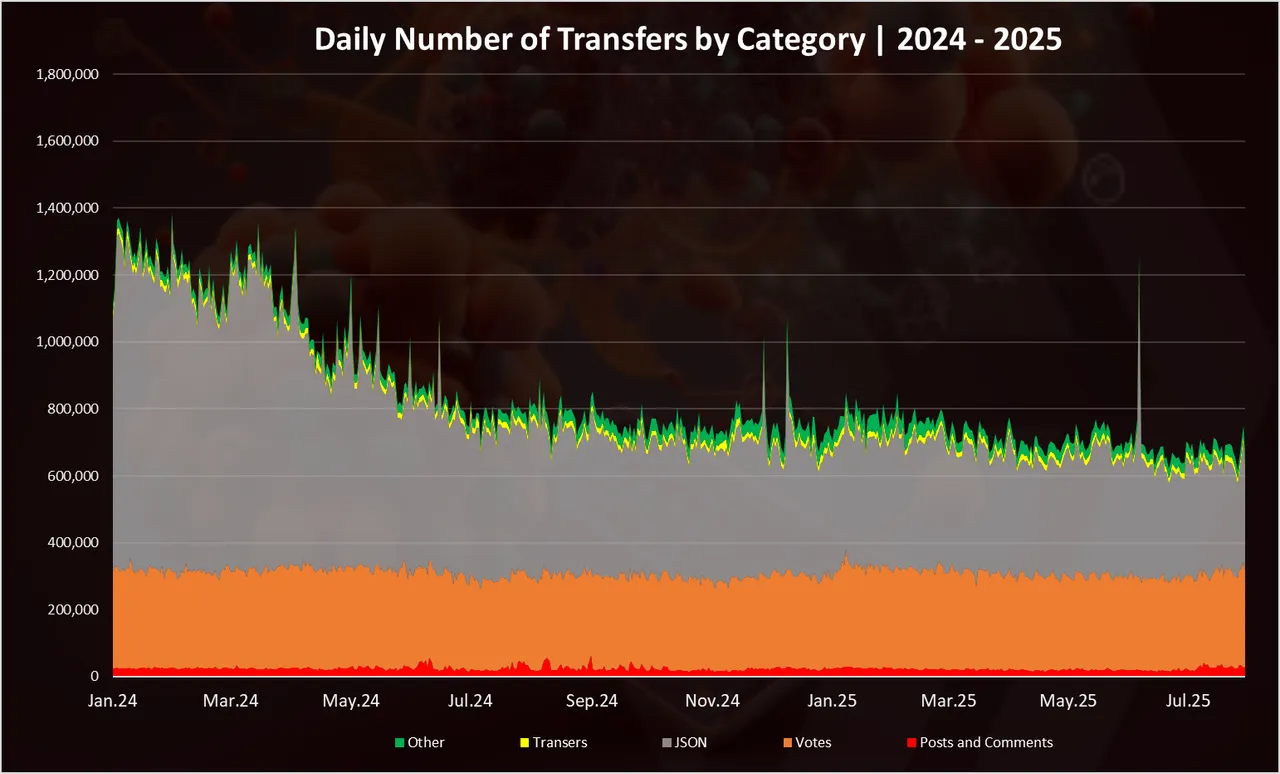
Here we can notice the drop in the daily custom_json transactions, and sort of very stable period in the last one year period with around 700k cumulative transactions per day.
Number of Posts and Comments
Although gaming is growing on the blockchain, blogging still remains the core activity and one of the key method inflations is distributed. Users can blog about gaming as well 😊.
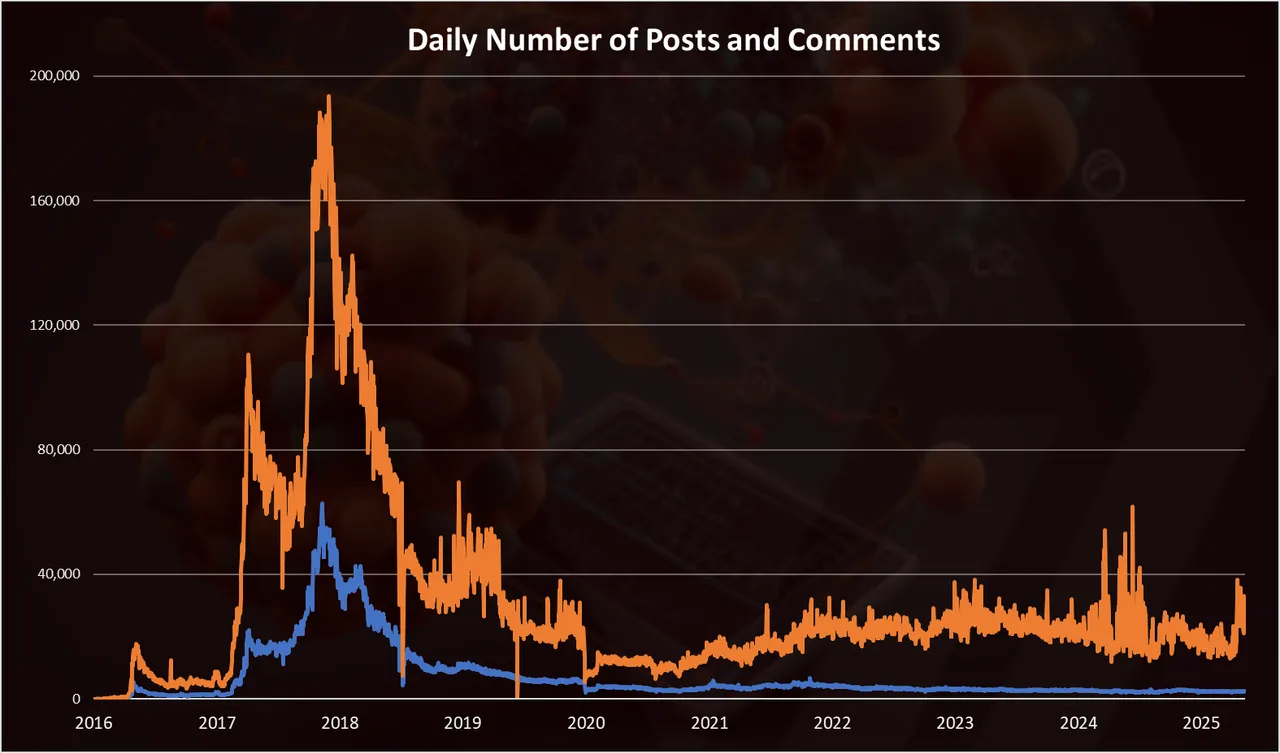
Here is the chart for the number of posts and comments on the Hive blockchain.
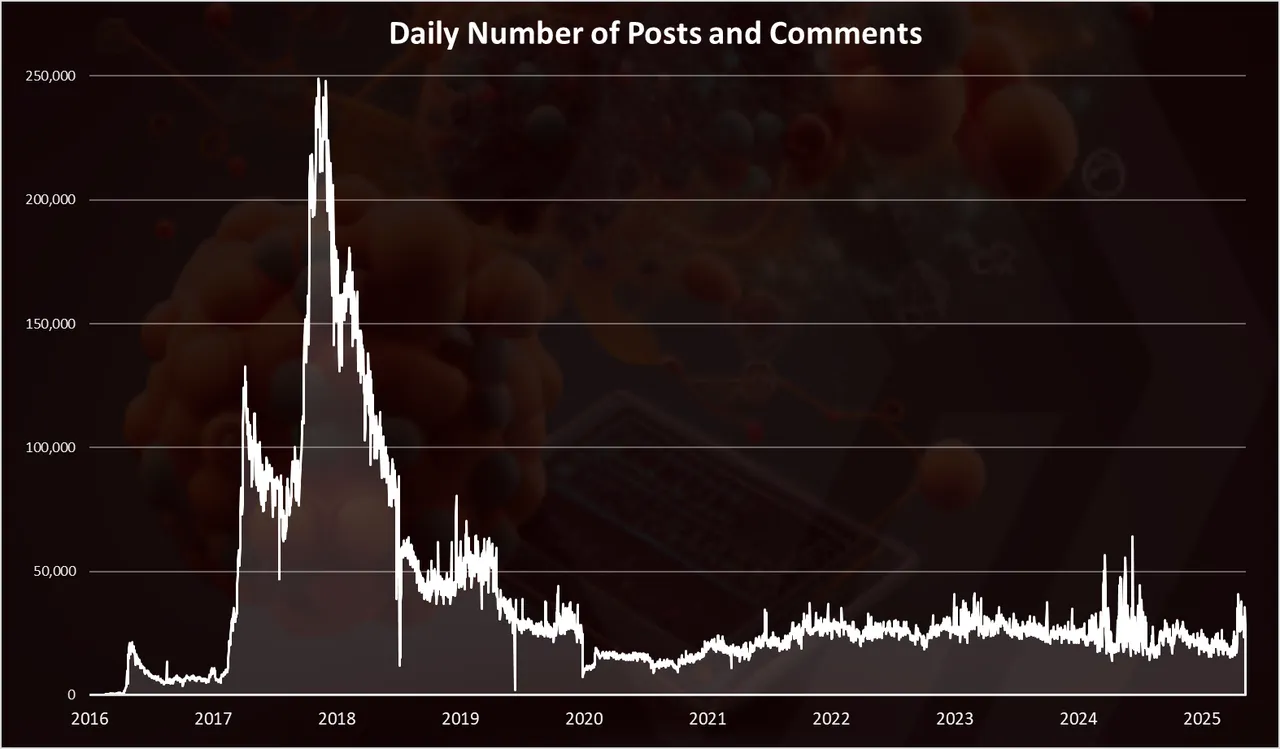
Here we can see that there is a totally different profile in the number of posts and comments then the overall transactions.
The highs for posting was reached at the end of 2017, with 250k posts and comments per day. A drop since then to a lows of 10k per day in 2020, and an increase close to 30k since then. There are some spikes in between that are mainly caused by the shortform apps and comments.
When we breakdown further these type of operations on posts and comments we get this:
As we can see comments have always been more numbered, that is understandable due to their short form, but in the last period they have grown even more. As example back in 2017 the ratio of comments to posts was around 4, while now this ratio is 9. Meaning there are 9 times more comments than posts.
This is mostly driven by the short form apps like Snaps (PeakD), Waves (Ecency) and InLeo.
When we zoom in 2024-2025 we get this:
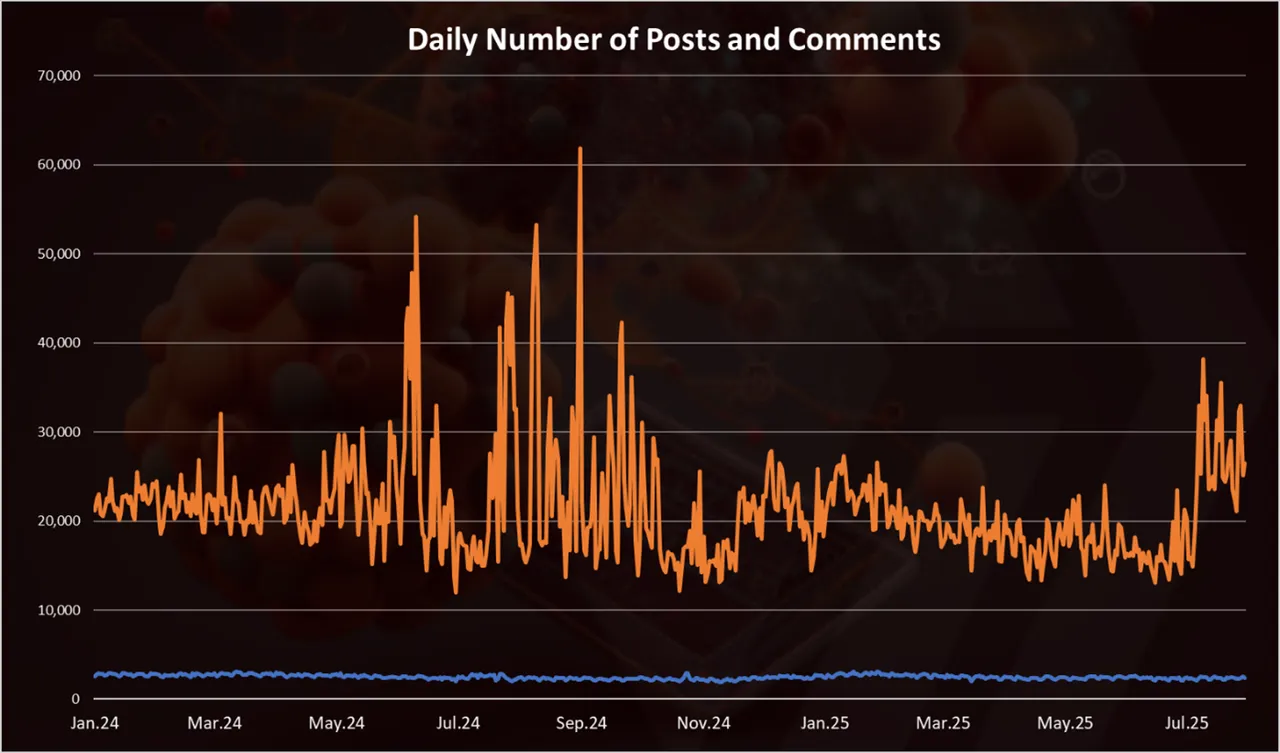
We can notice the volatility when it comes to comments in the range of 15k to 60k comments per day, but on average somewhere around the 20k, while the posts are very stable around 2.5k per day.
In the last period there is around 20k comments and 2.4k posts per day.
Number of Custom JSONs operations
The chart for custom JSONs operations.

This is the number one type of operation on the blockchain at the moment.
This is the most volatile chart of all the types of operations on Hive. It mostly follows the Splinterlands development and activities. The ATH for custom jsons was back at the end of 2021, when on occasions there was 5M transactions per day.
Afterwards the number of custom jsons operations has dropped and now is in the range of 300k to 400k per day.
Number of Votes
The chart for the votes looks like this.
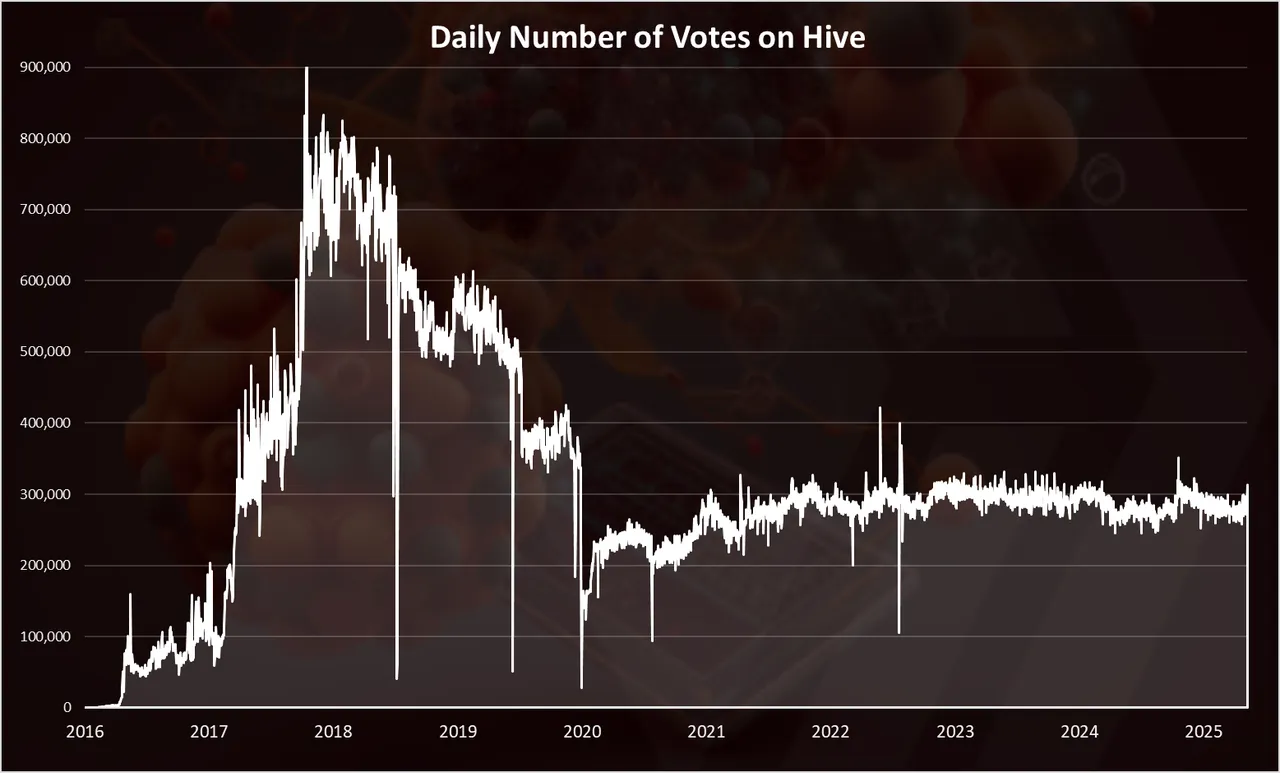
Votes are one of the core operations on the Hive blockchain. That is how the rewards are distributed. The Proof of Brain mechanism (PoB).
The number of votes has spiked close to 1M back in 2017, then dropped to 200k in 2020, and increased slightly since then to around 300k, where it has been for years now.
Monthly Number of Transactions per Category
The monthly chart presents a better overview of the transactions. Here it is.

We can see that the custom json operations are dominating the chart and are defining the trend.
The ATH was back in November 2021, with more than 100M operations.
When we zoom in 2024-2025 we get this:
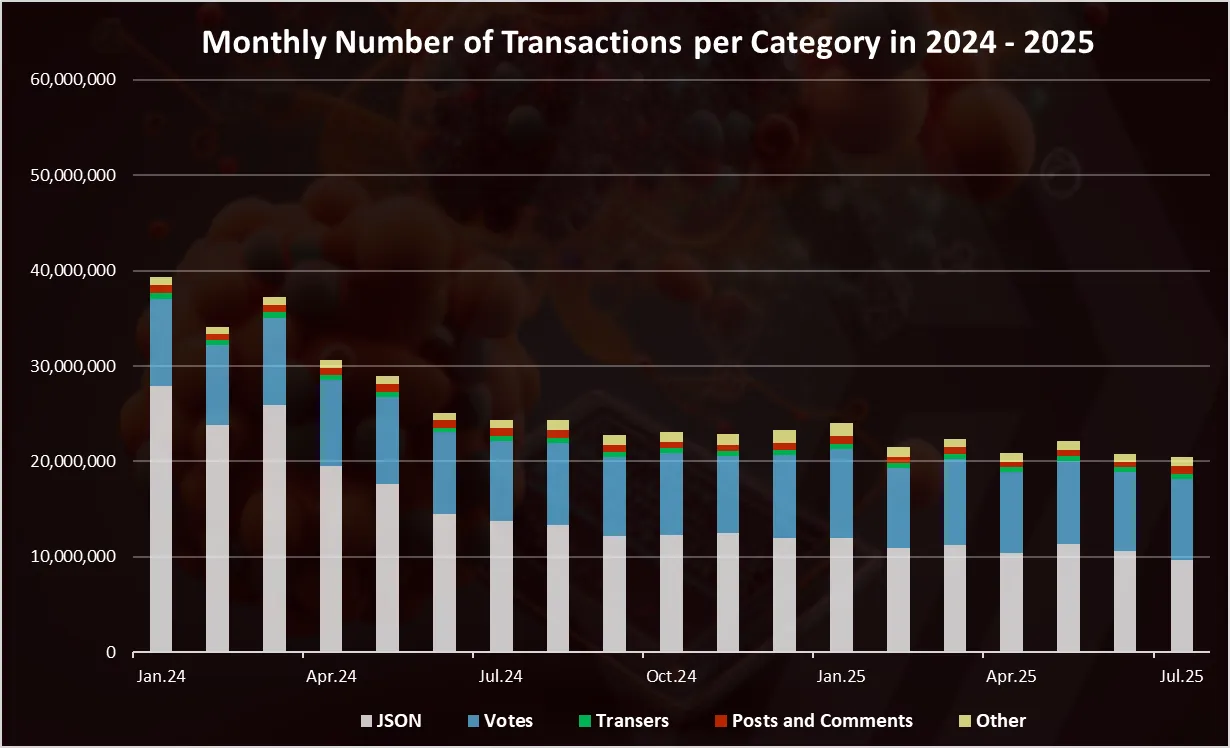
At the begging of the 2024 there were around 40M transactions per month, the it dropped close to 25M. In 2025 there was a slight drop and the number of transaction per month now is just above 20M, with votes and custom_json close to 9M each.
Top Operations in July 2025
Here is the chart for the transactions per category for the last month.
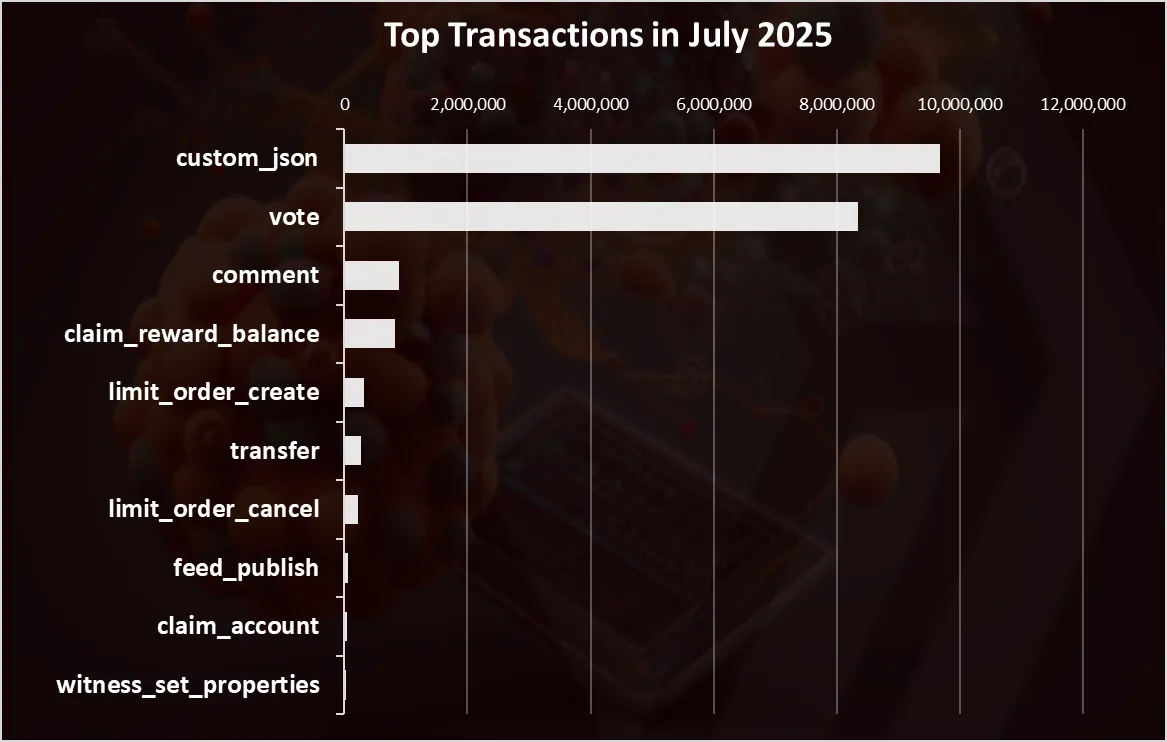
Not surprising, the custom jsons comes on the top with 9.6M monthly transactions. Next are votes with 8.3M, and then comes the comment operation, that represents both posts and comments with 900k monthly operations.
Claim rewards, trnsfers, trading operations on the internal DEX are also in the top 10 operations on the chain.
The pie chart looks like this:
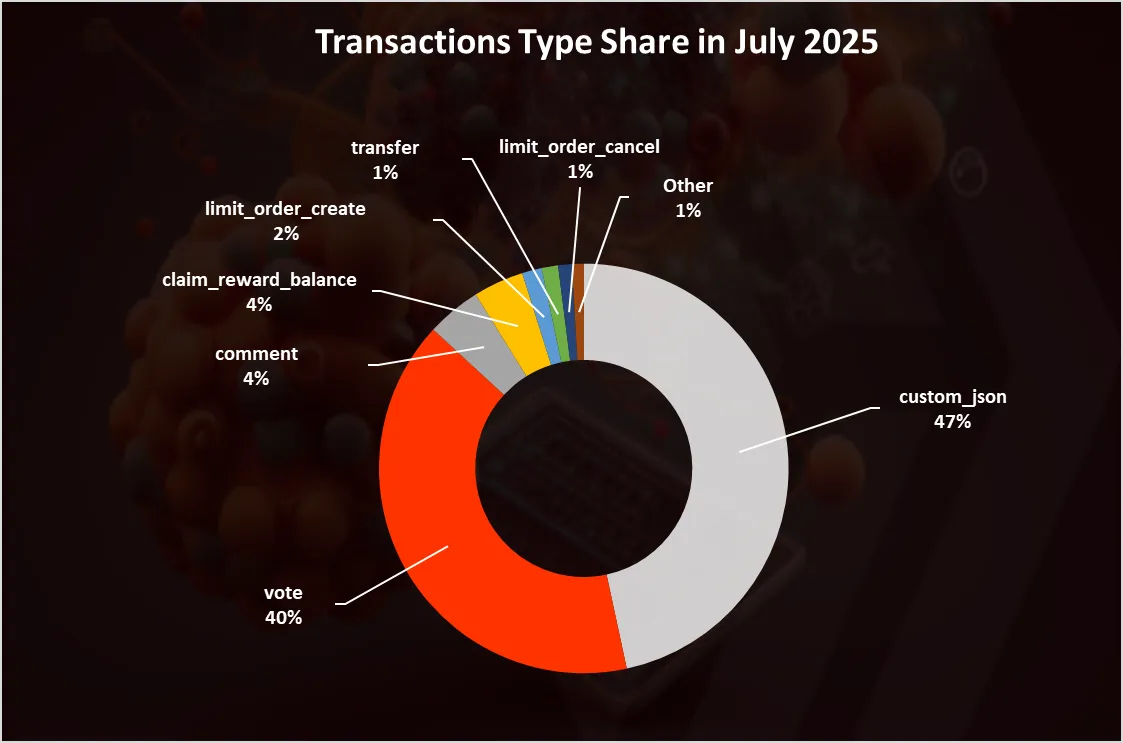
Here once again we can see the custom json transaction and votes as dominant.
A reminder once again that while these type of operations are dominant, they usually represent a one click operation, that is with much less effort then writing a post and publishing it. They also take much less space on the chain, while long posts can be heavy on the memory and require more RCs.
All the best
@dalz