Downvotes and User Retention
Downvotes are perhaps the most controversial topic in the Hive space. They have been a contentious issue since the beginning of Steem back in 2016 and remain so to this day. Detractors consider them to be a form of censorship and that their existence is contrary to the widely stated goal of censorship resistance. Proponents claim that they are a necessary evil, without which the network would devolve into a free for all where the rewards pool exists only to line the pockets of those willing to farm them as aggressively as possible. Downvotes are so contentious that there has even been a fork of Steem created with the stated goal of eliminating censorship by having a downvote-free chain.
It should come as no surprise then that there is also a widespread belief that downvotes contribute to the low levels of user retention that Hive experiences. The purpose of this post is to break down that idea into something testable, and if possible to try to answer it with data.
Downvote Hypotheses
When we think about measuring downvotes, it quickly becomes clear that we probably need to treat it as not just one hypothesis but a category of closely related hypotheses. What is it about downvotes that would cause people to leave? Is it the removal of rewards and a sense of loss? Is it the feeling of having that post you worked hard on rejected? Is it the perception that downvotes give of a community rife with drama and conflict?
Thinking along those lines, here are some possible metrics we could use to measure downvotes. Each metric attempts to focus more closely on a precise potential cause of users leaving.
- The number of downvotes every day
- The number of downvotes that substantially remove potential rewards from a post (ie. removing more than a few pennies from a post).
- The number of whale downvotes (ie. that could fully or nearly wipe out a posts rewards).
- The number of downvotes directed towards new users.
- The number of downvotes directed towards highly popular users.
- The number of heavy downvotes towards new users.
etc.
These are just a few examples of how we could try and examine the data, I am sure that readers can come up with more variations along these lins.
In this post I will just look at the first three, but it may be worthwhile to examine related ideas in the future.
Measuring Downvotes
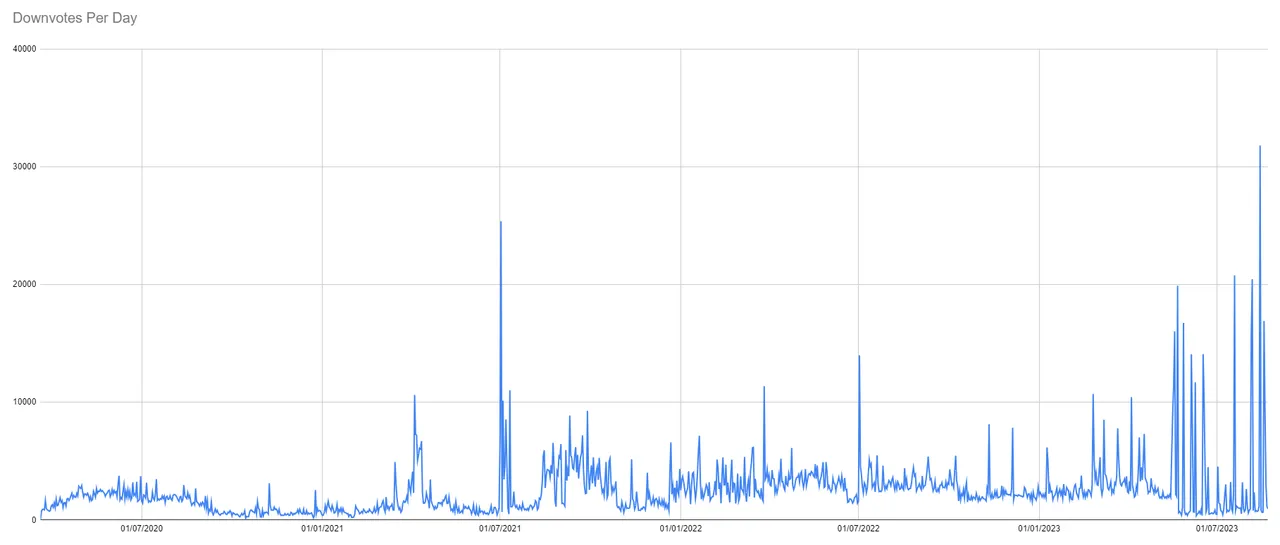
1. Downvotes Per Day
The first metric is the simplest to measure. Below is a chart of downvotes per day.
Here are a few more charts that provide more context in terms of how downvotes fit into voting overall.
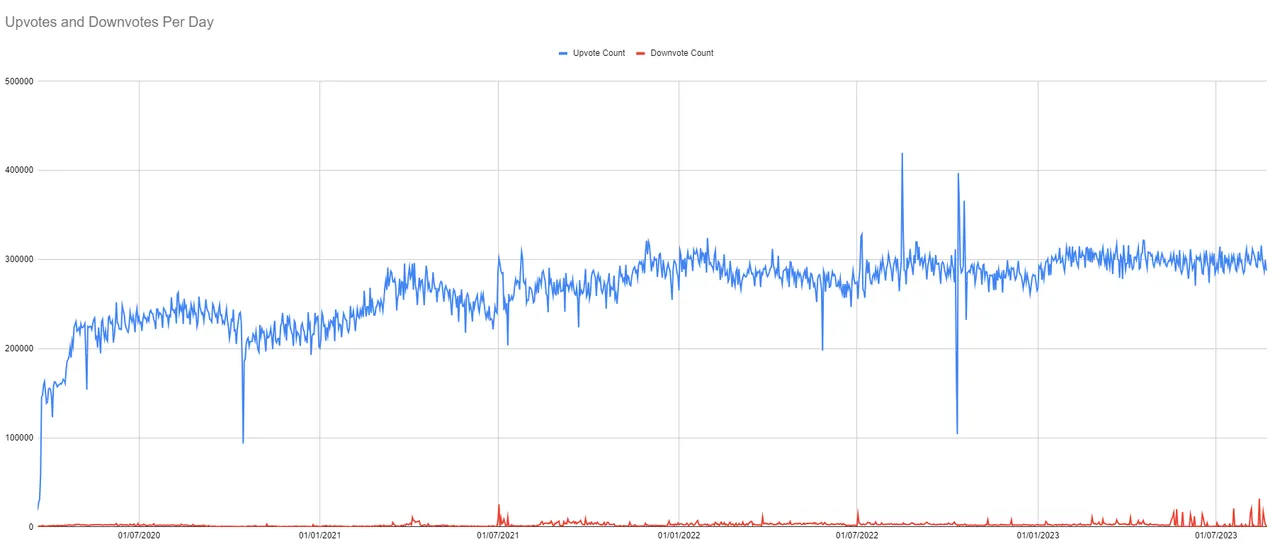
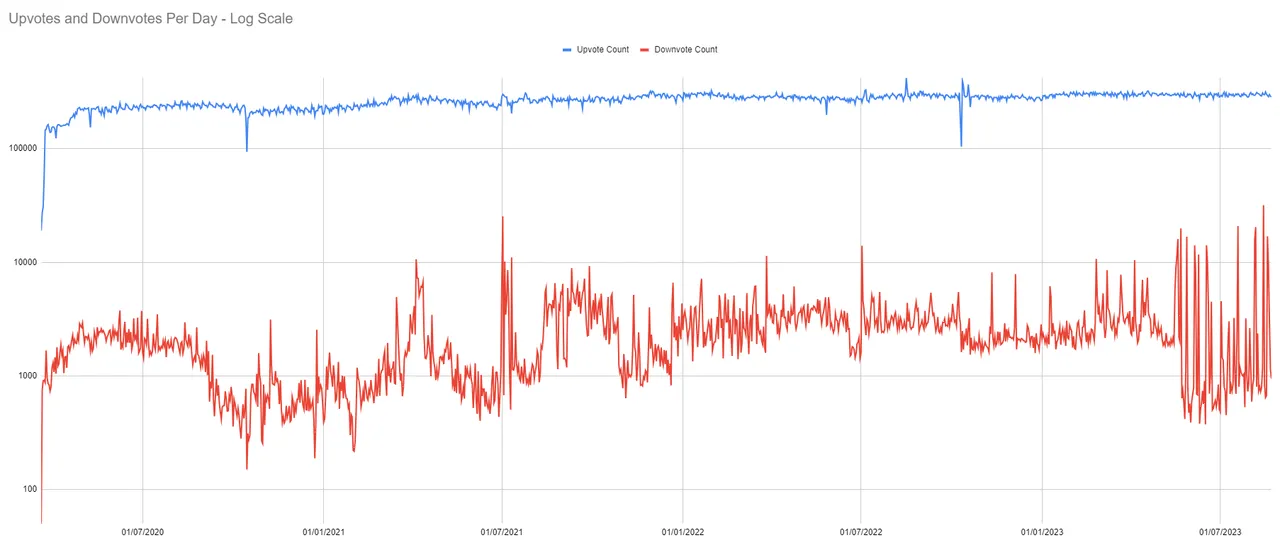

As you can see, downvotes usually represent a tiny proportion of all votes, but they are much more variable and can sometimes go nearly as high as 10% of votes overall.
2. Heavy Downvotes Per Day
As far as I'm aware, HiveSQL does not have any table which tracks the full monetary value of a vote, be it an upvote or downvote. It keeps a record of the weight, a number between 10,000 and -10,000, but the effective value of a vote depends on more information, the voting power of the account at that time, how much stake the user has at that time and also how much reward is applied per r-shares. To get the full value, you have to recalculate the state of the chain, which is too complex for my purposes here.
I can however use a bit of a hack. A user who is earning substantial curation rewards also has a substantial downvote. Curation rewards are tracked directly in HiveSQL, so I can use that as a proxy to find users with a substantial downvote.
I define Heavy Downvotes as those downvotes with weight of at least 50% by accounts whom are earning an average curation reward of 1000 Vests (typically about 0.5 Hive) 7 days later from their upvotes. This will miss users who are not curating and it may also miscategorize some users who curate with lower percent rates, but I still expect it would be a high level of coverage. Below is a chart of "heavy downvotes" per day.

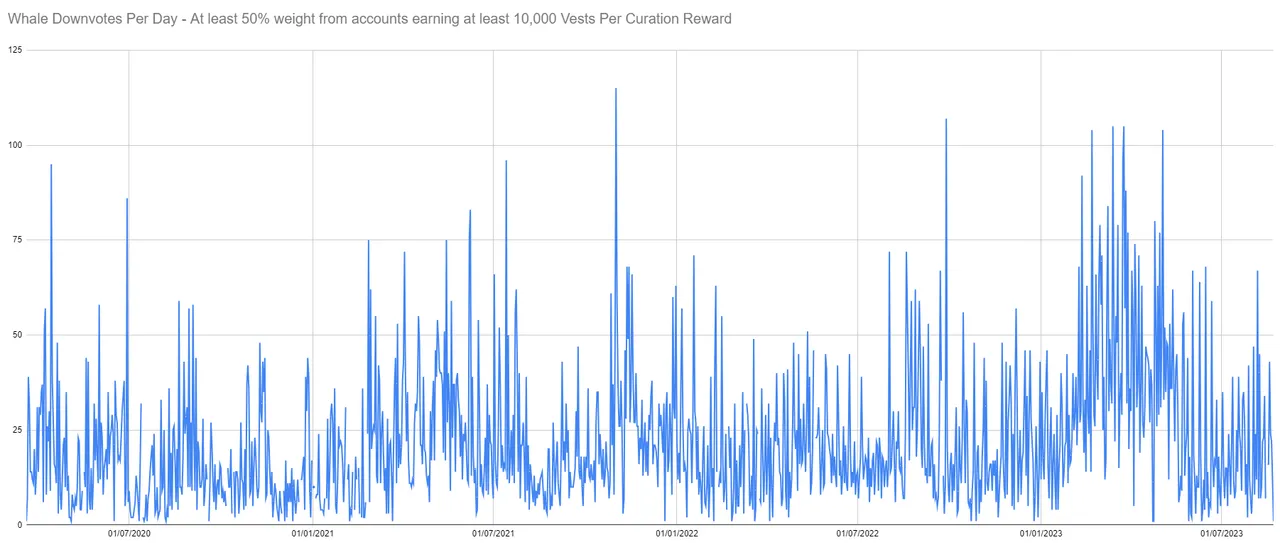
3. Whale Downvotes Per Day
Finally, whale downvotes are measured in the same way, but merely increasing the required level of curation rewards, which are proportional to stake. I treat users earning at least 10,000 Vests (about 5 Hive) per curation reward as whales here.
Analysis
If users go inactive because of downvotes, we would expect that these metrics have predictive value towards future user activity. This means we can use Granger Testing to test these hypotheses. If you are interested in the methodology, my post on Splinterlands and Hive Price goes into detail.
First the datasets must be determined to be stationary. All three are determined to be stationary with Augmented Dickey-Fuller tests.
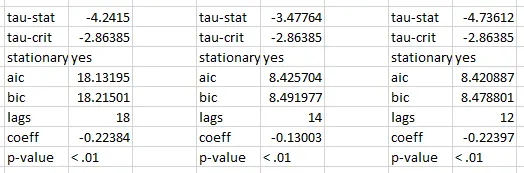
Daily changes in active user counts have been determined to be stationary in prior posts.
This allows us to proceed to Granger Tests. I test the number of downvotes, heavy downvotes and whale downvotes against change in user activity per day to determine if any have predictive value. Results are below.
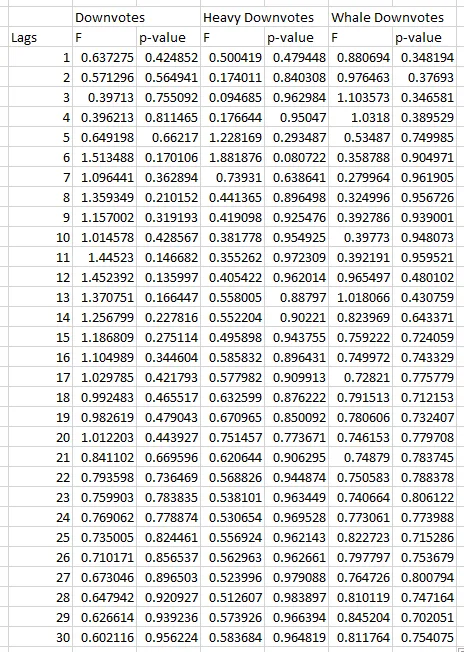
There are no statistically significant results in this data.
Conclusion
Using direct measurements of downvotes per day as well as a proxy measurement for "heavy" and "whale" sized downvotes per day, I find no statistically significant impact on user activity.
This doesn't completely rule out downvotes as a factor in user retention, but it may require refining the hypothesis and focusing on a more granular set of data, such as downvotes on new users. However, in general the data presented here does not support the hypothesis that downvotes contribute to Hive's user retention problem.