Another week of rewards have been distributed to HIVE authors, and it is time to look, again, in depth at who and what got rewarded, based on word counts, post structure, images, and a number of other bits and pieces. Before I begin with the report, there are some new features I have built into my data set, that enable greater analytical depth.
Whats New since last week?
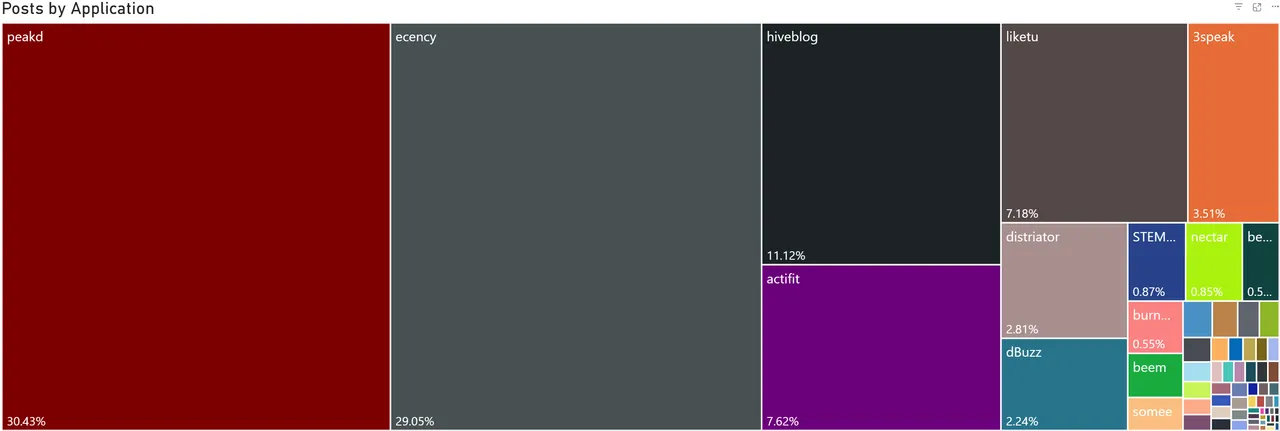
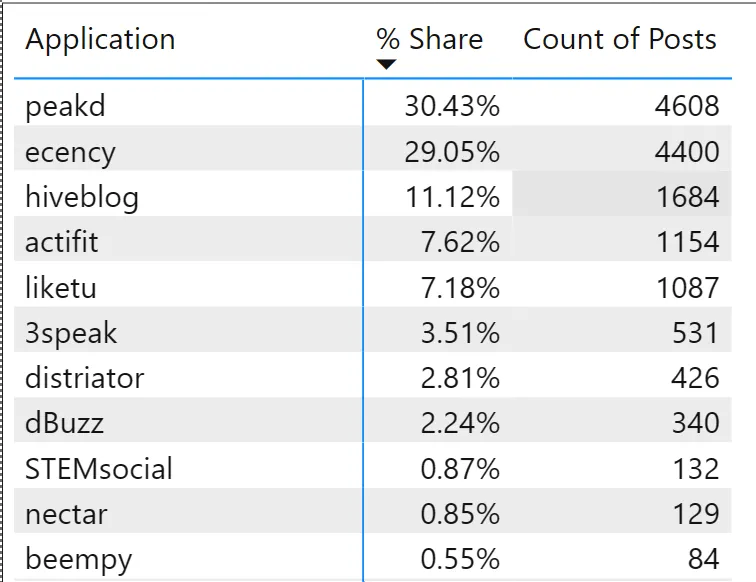
Word count by HIVE interface!
This will allow better comparison between like for like posts, for those who do not see word count as "value" or "effort" put into a post. It also also direct comparison of the trends of content created by users of different interfaces.
Here is how that data was extracted - it is derived from the json_metadata column. Extraction occurs via a custom column.
This is a little more difficult than I first anticipated, as the json_metadata field does not consistently place the "app" value. Therefore, I have had to do some... really quite bad stuff in a Power Query Custom column in order to extract which application was used for posts.
let
    sourceText = [json_metadata],
    appKeyPos = Text.PositionOf(sourceText, """app"":"),

    result =
        if appKeyPos <> -1 then
            let

                afterApp = Text.Middle(sourceText, appKeyPos + 6),

                trimmed = Text.TrimStart(afterApp),

                firstQuote = Text.PositionOf(trimmed, """"),

                afterQuote = Text.Middle(trimmed, firstQuote + 1),

                secondQuote = Text.PositionOf(afterQuote, """"),

                appValue = Text.Start(afterQuote, secondQuote)
            in
                appValue
        else null
in
    result
Since I am using Power Query, this is the quickest way I could fathom to get this feature up and running. I may improve the methodology in the future, but at least this gives me a base line.
This also gives me the ability now, to exclude certain applications from the reporting, which should get closer to the "true" posts written by authors, as opposed to by a curation service which uses automation such as beem or other libraries that interact with the HIVE chain.
The visuals below are for just the most recent week of data, as a proof of concept.
Here is some more, polished detail:
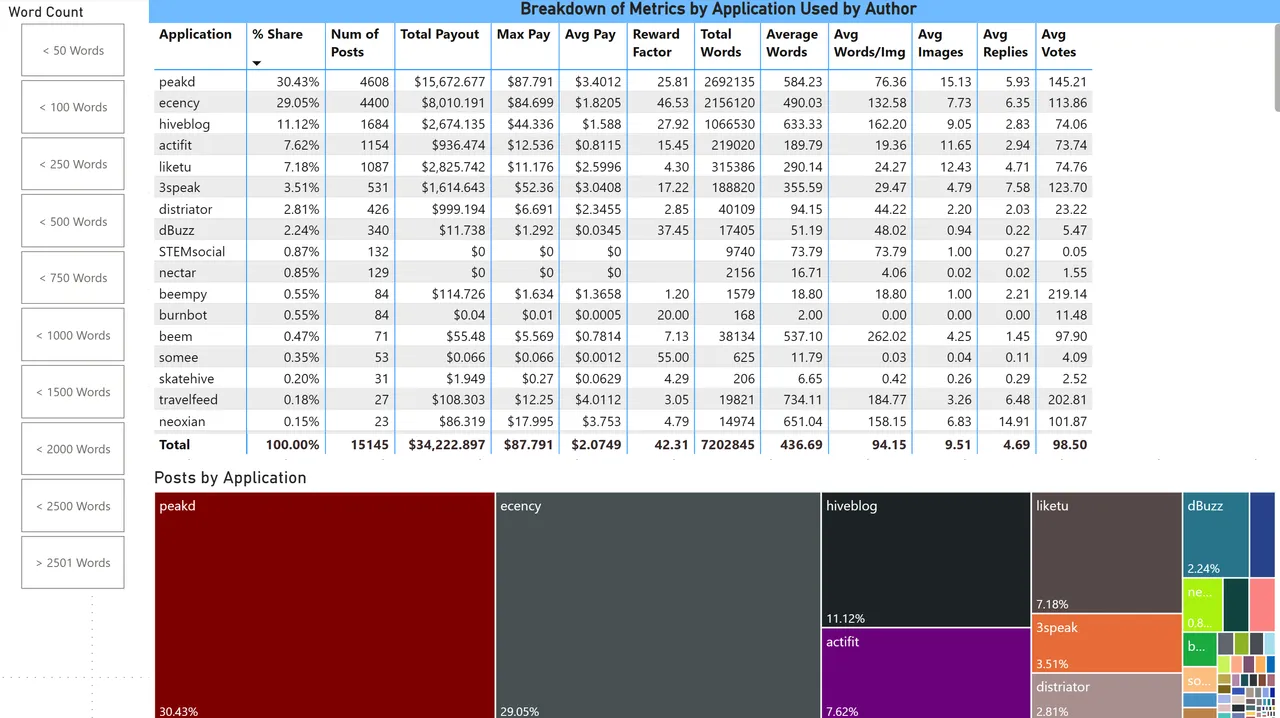
Reply Depth, and Average Replies
I've added data points for reply depth (how many replies a top level post generates) and average and median replies to posts.
Week on Week Data
Now that I have a 2nd week of data, I can compare trends in posting week on week. Is there really a dearth of content, or are we just imagining it?
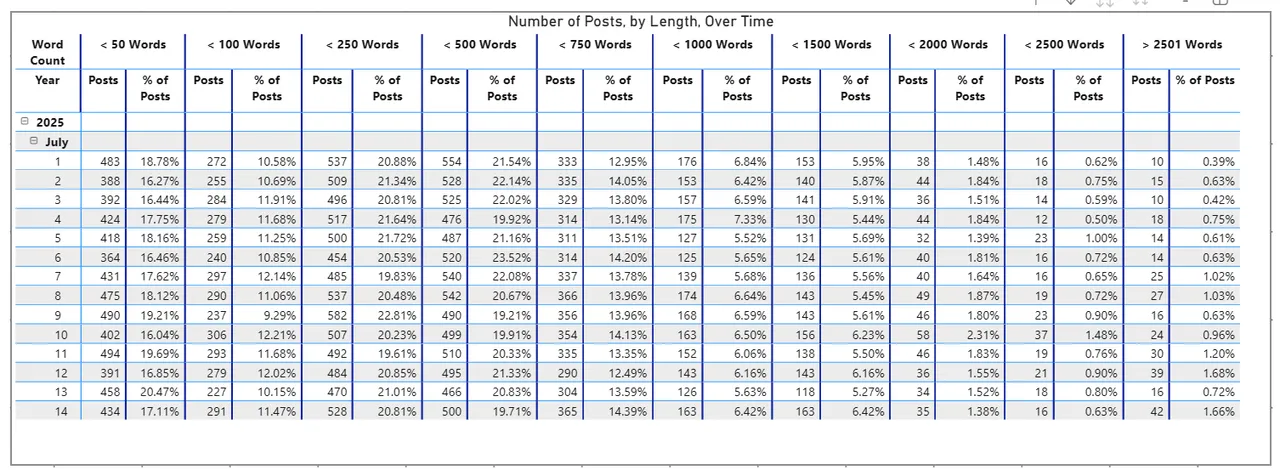
Seems like there is about the same number of posts. Posts seem to be getting slightly longer, which I think is great, but not everyone agrees, as not all posts are long stories, or long reports.
Anyway, onto the usual reporting:
The secondweek of July is now over, and I've refined the process even further (As evidenced above!)
I am still keen to hear from all of you what you think of this data, and how it can be further improved in the future.
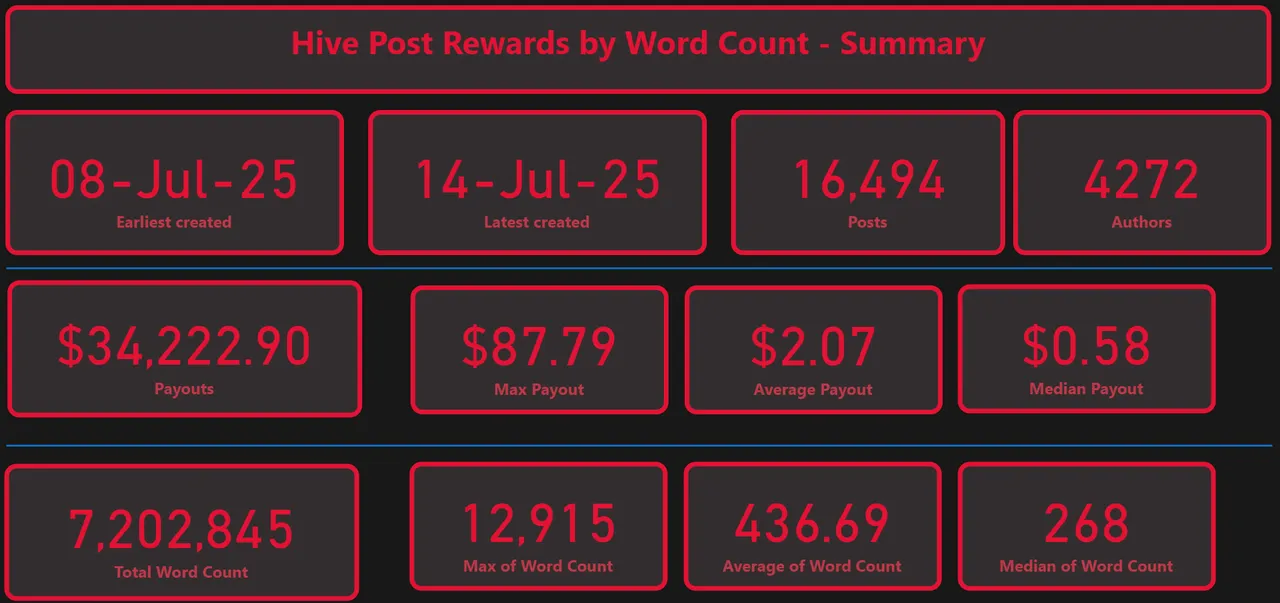
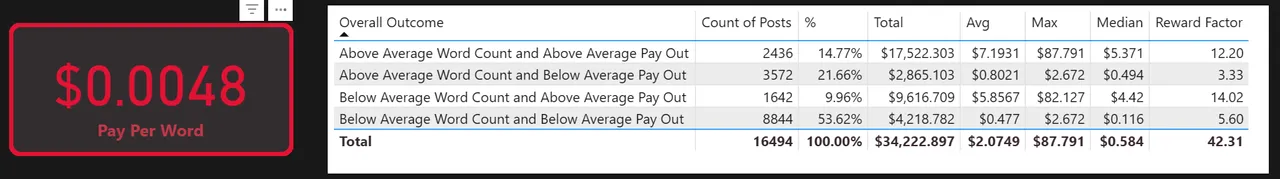
For the second week of July, there was $34,222.9 in rewards distributed, compared to $32,266.35 for the prior week. The average payout increased by four cents. The max increased from $85.60 $87.79. The median was reduced from $0.63 to $0.58.
The highest word count was 12,915, a little bit longer than last week, the average was up to 436, and the median decreased by three, from 271 to 268.
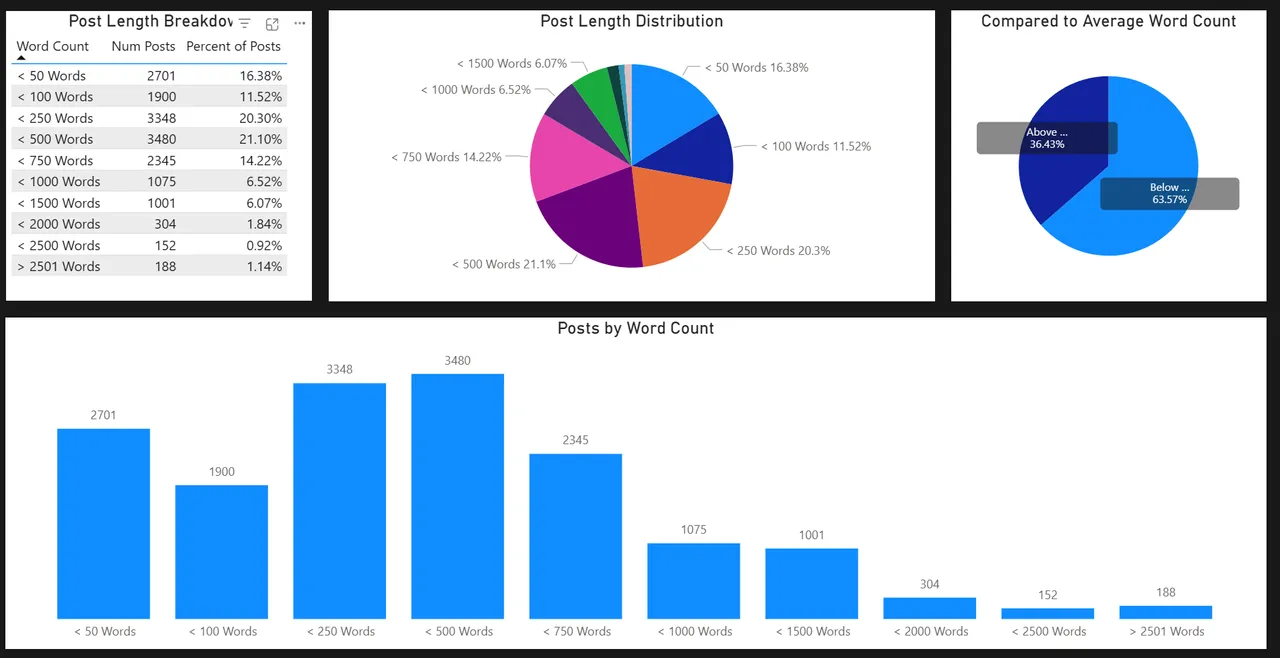
The overall trend of shorter posts being the more dominant on the platform continued, with only 36.43% of posts being longer than average.
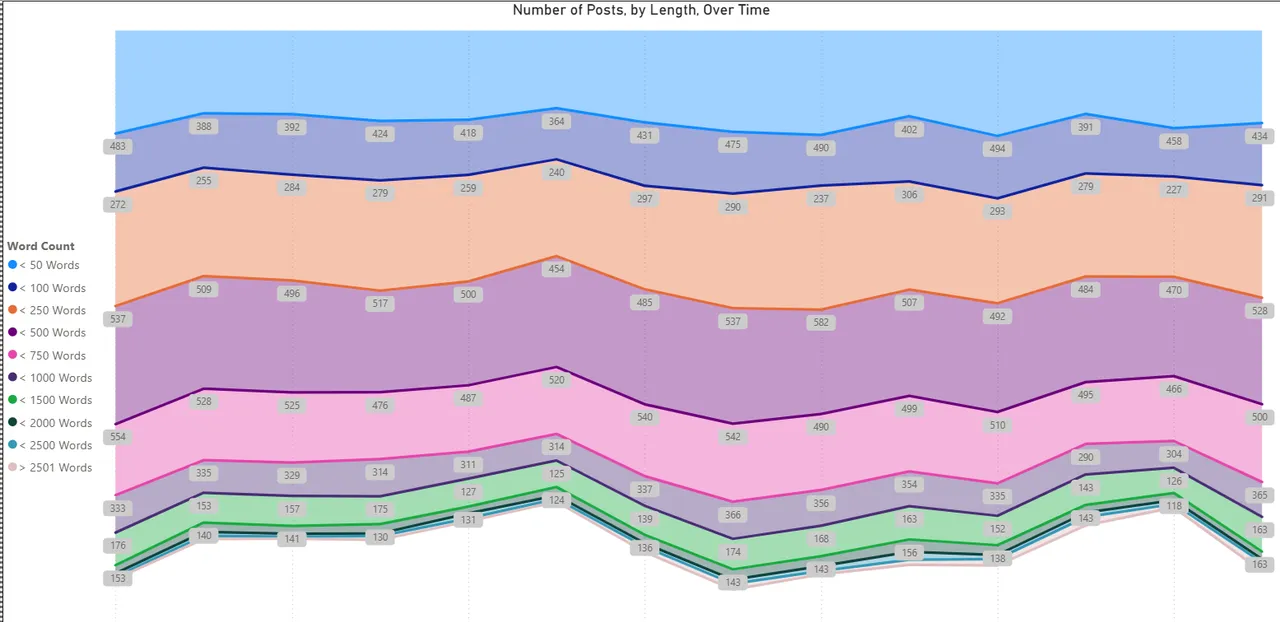
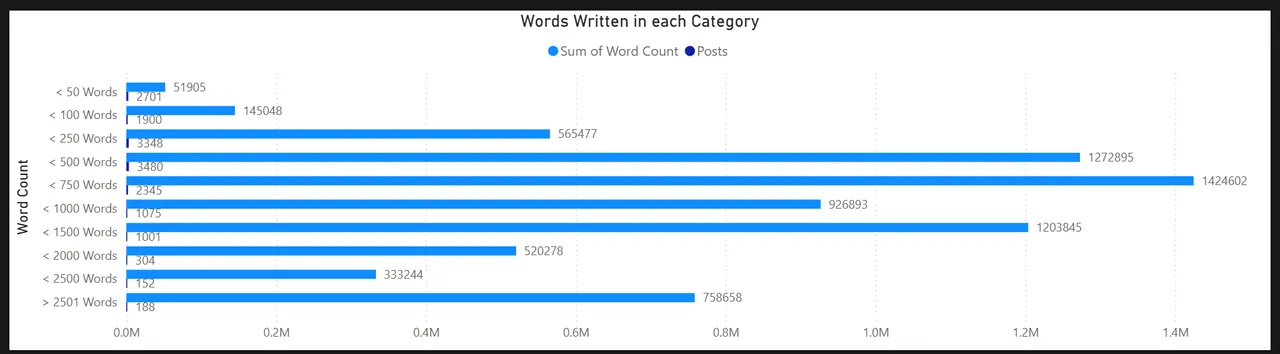
7.2 million words were published in total on HIVE for the period, and here is the distribution from last week, which you can compare to the above for this week.
While there were more of the longest types of posts, in the 2000+ word category, there were less in the <1500 and <1000 word categories.
Last Week:
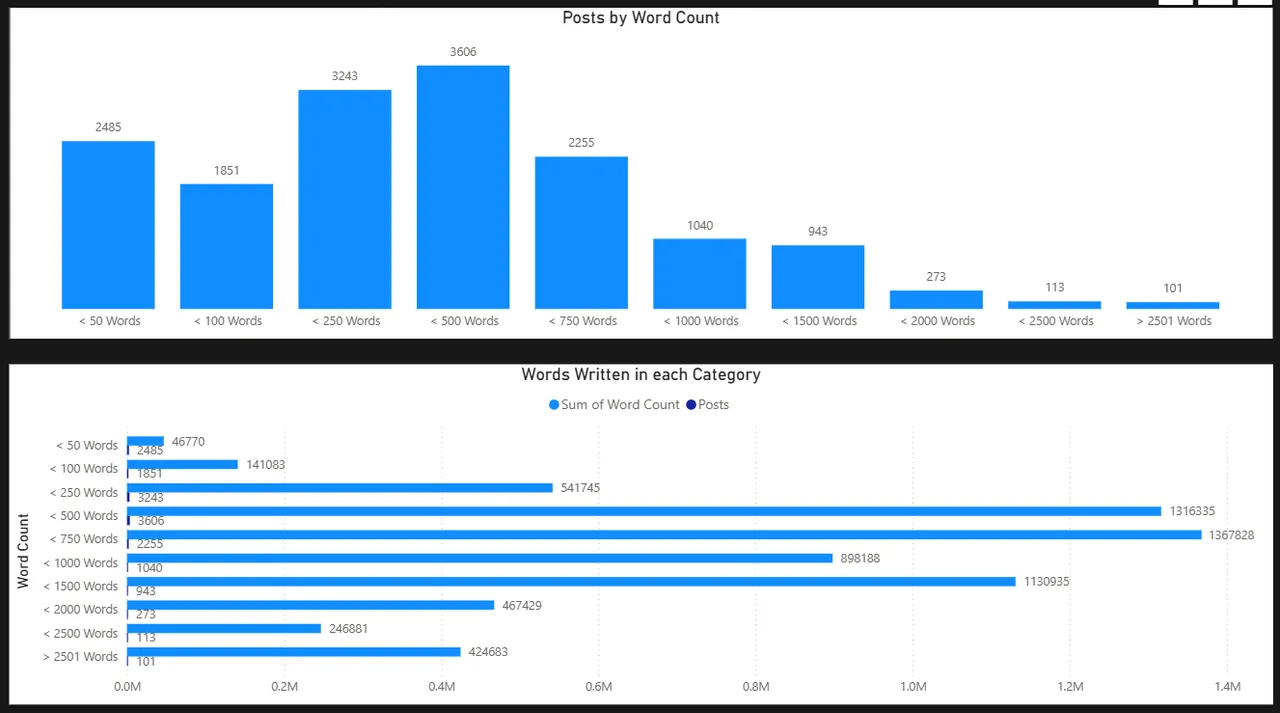
Back to this week:
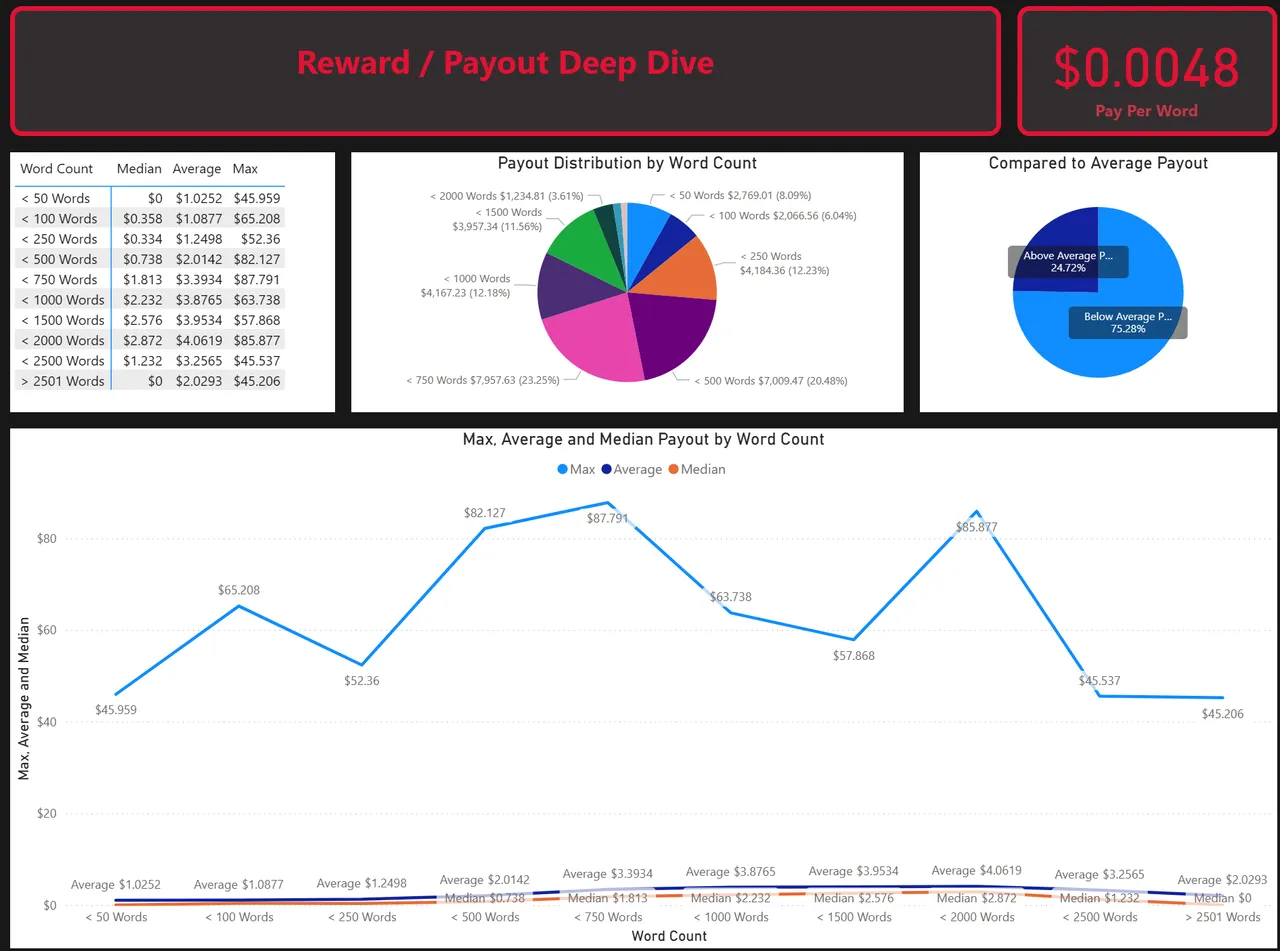
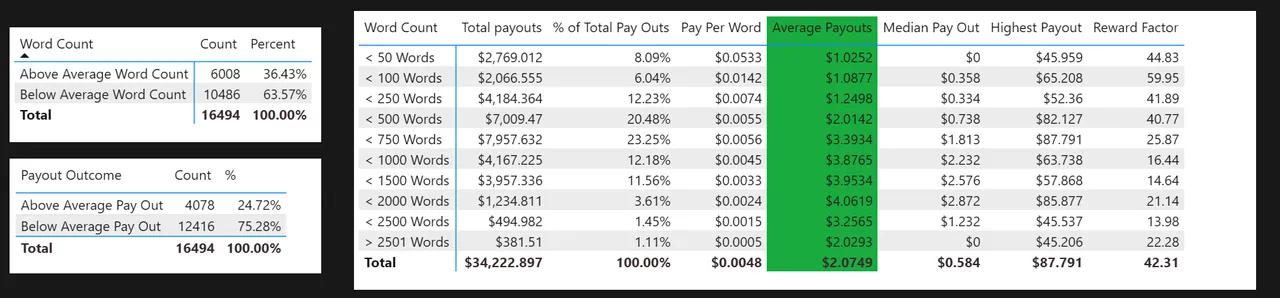
Pay per word was about the same since the last set of data was imported, and the majority of the payouts went to posts under 750 words. Sadly, average payouts to shorter posts increased, but payouts were up across the board, seems like there was a little more in the reward pool.
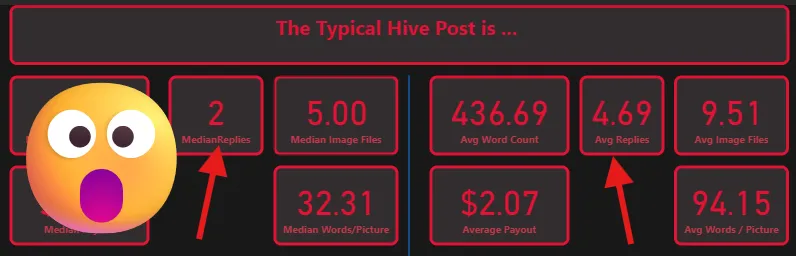
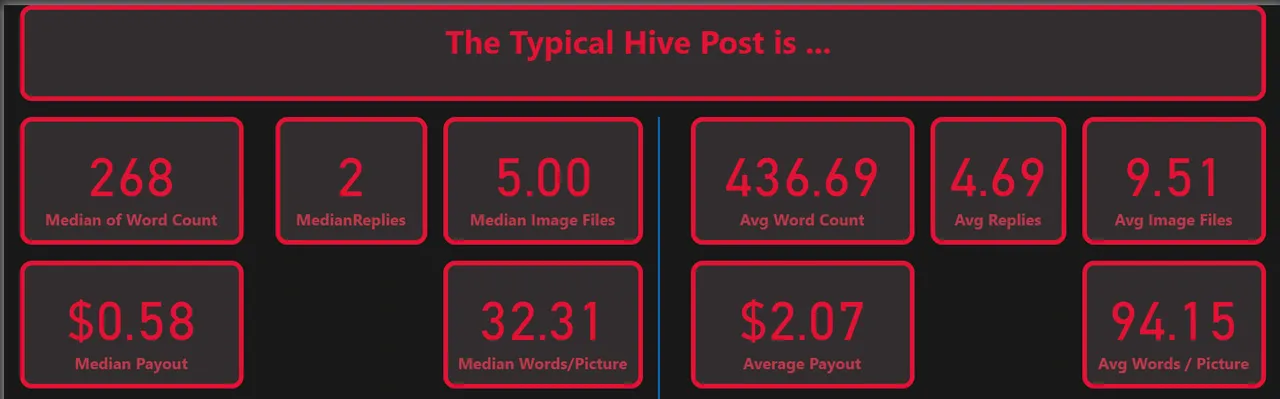
What about the typical post on HIVE? What does that look like? Well, thankfully, here's some stats - this week with some new data points, average replies!
Posts got slightly longer, included more pictures. Median pay was down, average pay was up.
It will be interesting to see how replies change over time.
There still isn't much difference between the median and average post, other than the fact that there's significantly more words in the average, and a few more pictures.
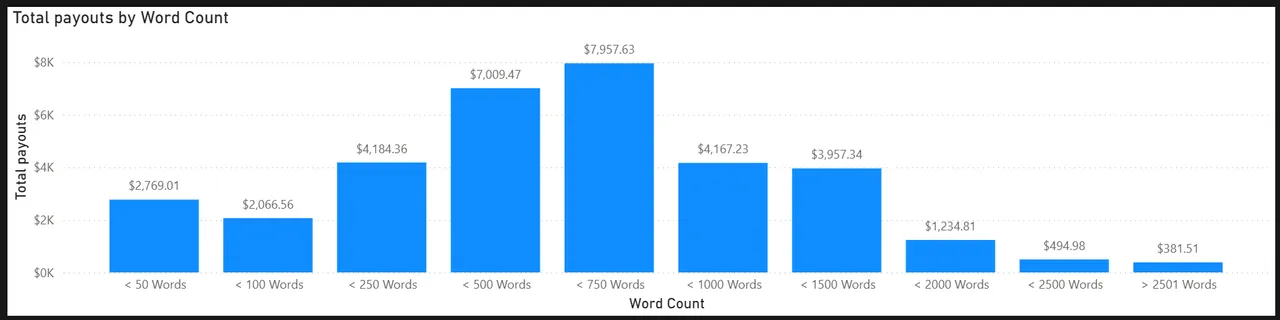
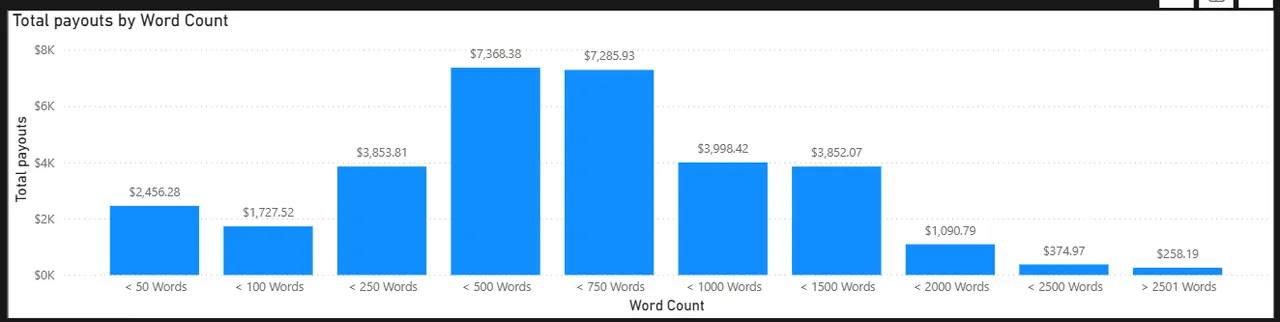
How does total, aggregated payout look, compared to the word count? A little bit like the distribution of the posts, it seems, with a steep falloff for longer posts.
Pleasingly, longer posts got a much larger percentage of the rewards than when compared to the week prior, while posts under 500 words appeared to "pay for this".
This Week
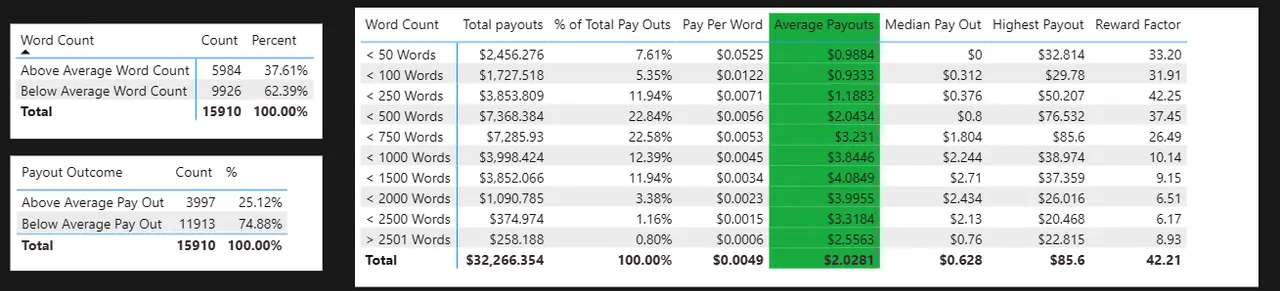
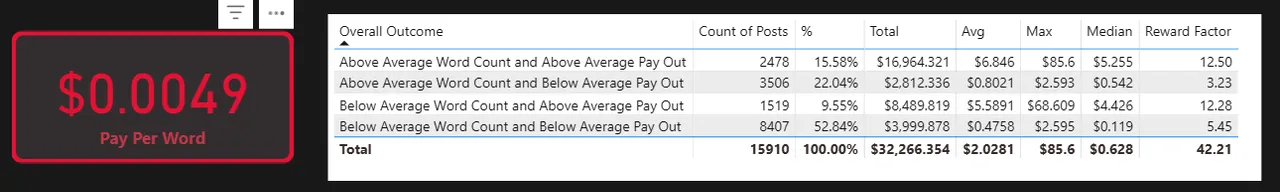
Last Week
How about when we consider a few more variables, and look at the reward factor? That is to say, the highest payout in a word count group divided by the average? Are these posts still 40x (overall) more valuable than the average post on HIVE?
This Week
Last Week
Moving On
Only 14.77% of all posts published on Hive were above average word count and above average pay out. 9.96% were below average word count, and above average payout. There is room for awards to be allocated by curators to those appearing in the above average word count and below average payout category. There's ~$7k of awards allocated to shorter posts, while longer posts go unrewarded.
There is too high of a reward factor on posts in the category of "below average word count and above average pay out". Again, that's max payout divided by average, presented as a number. In fact, it grew.
This Week
Last Week
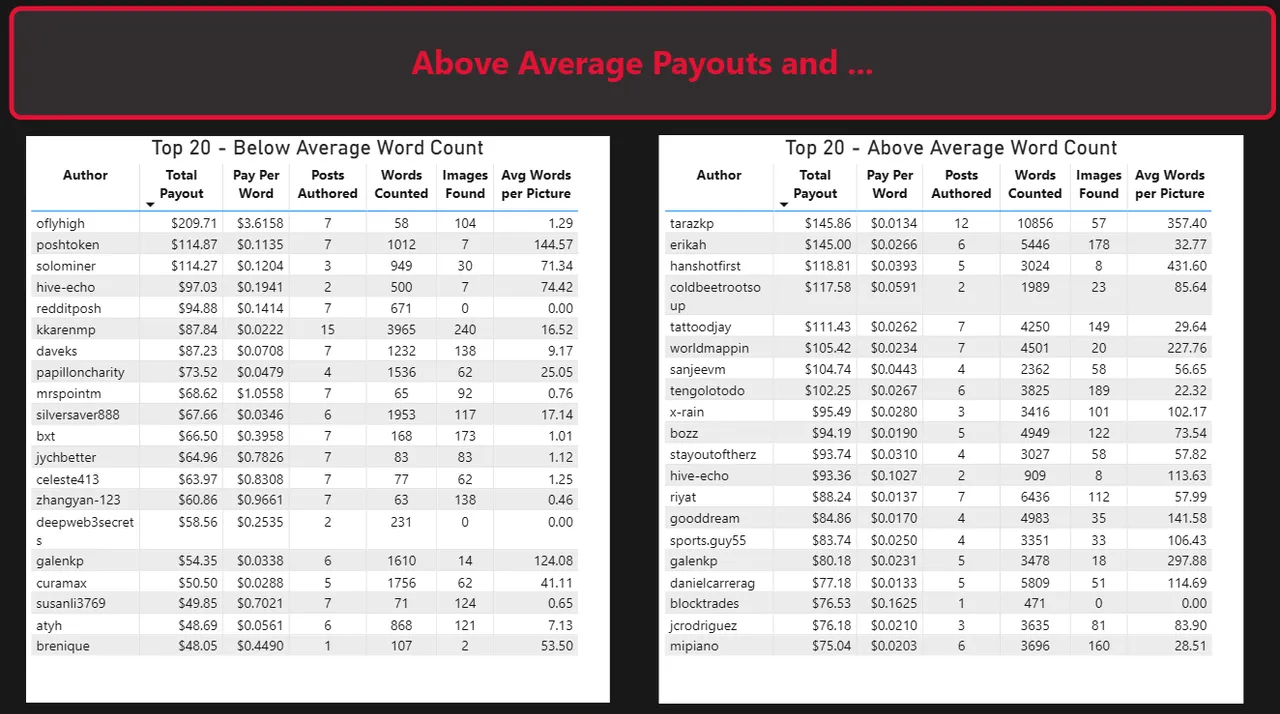
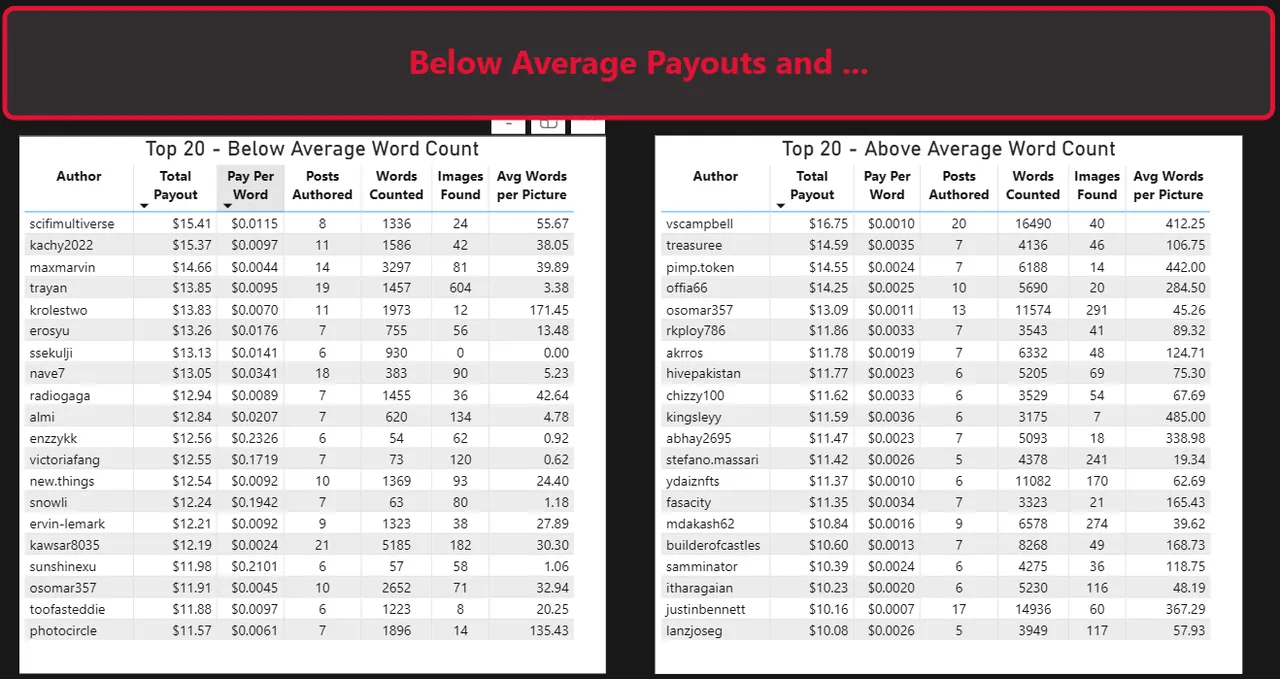
What about when we look at authors on an individual basis, for the period? (Or at least the top 20 for each category?
Last Week
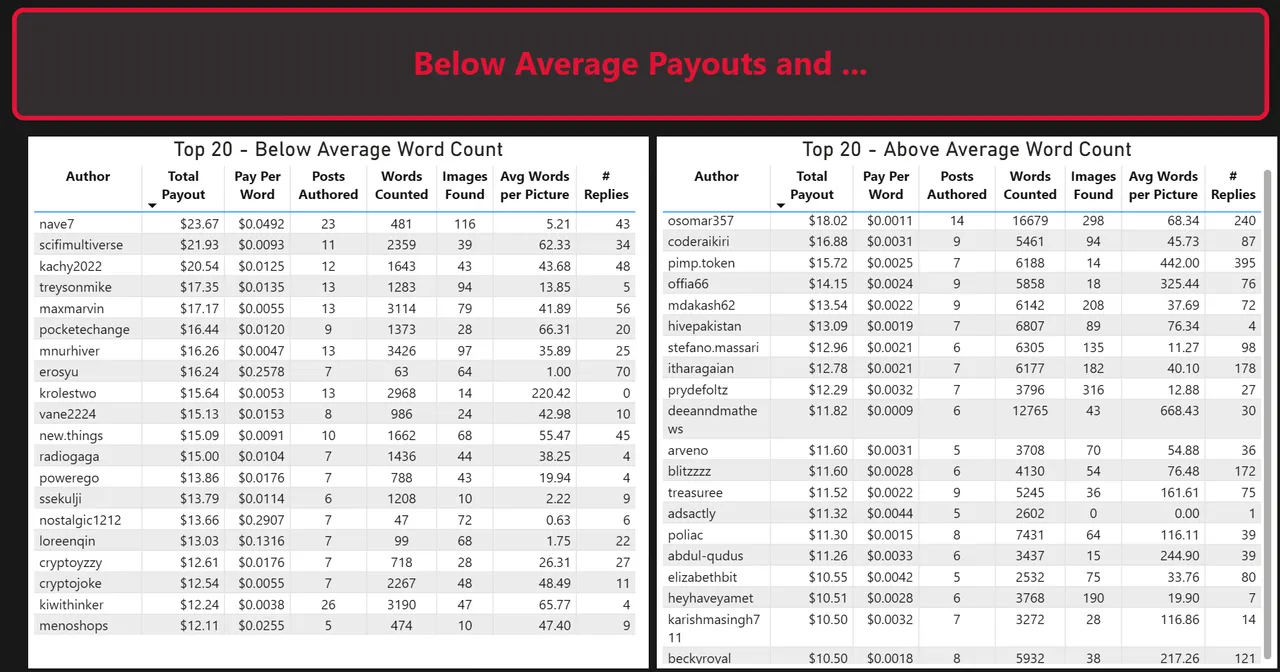
This Week
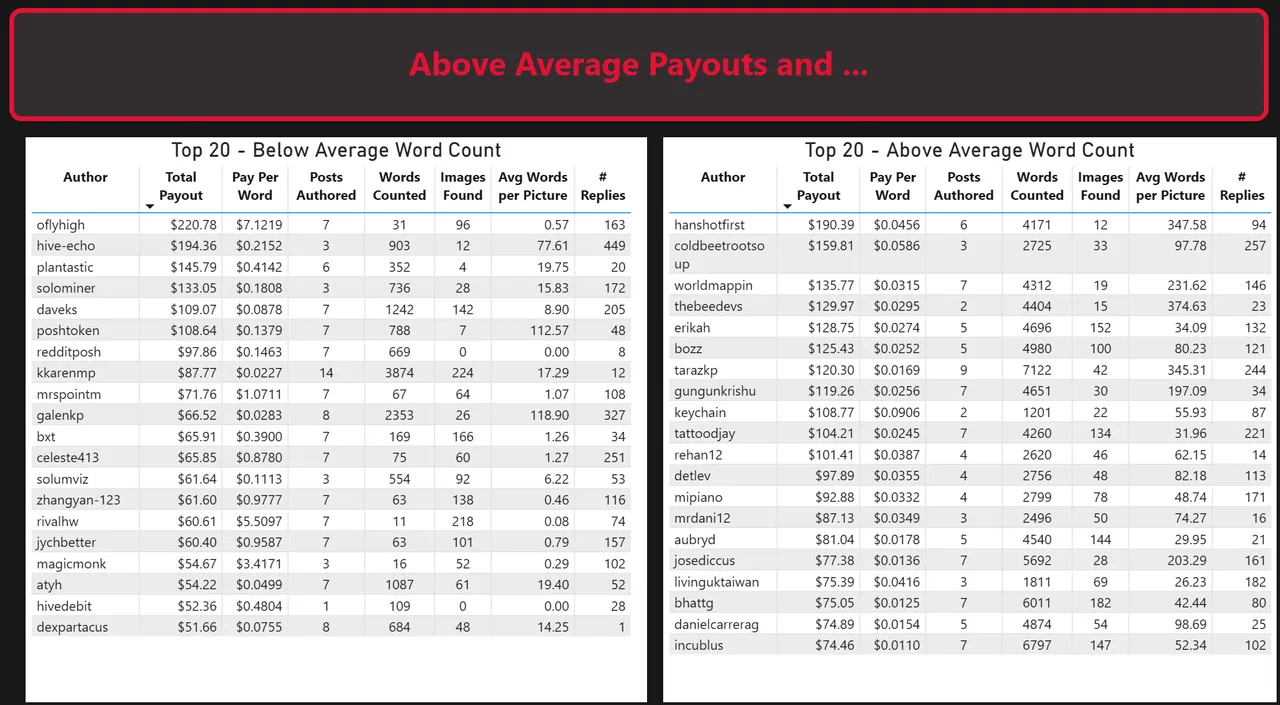
I have added engagement, by measure of total number of replies to an author's top level posts here. I am curious as to the range of comments received by authors in these categories. There's a wide variation in the engagement each author gets for their rewards, regardless of their word count.
The same authors tend to appear in the lists, week on week. They're consistent and persistent.
What about those potentially "emerging" authors, with Below Average payouts?
Last Week
This Week
The below average payout group seems to have some different names, apart from some of the token projects that seem to post daily round ups.
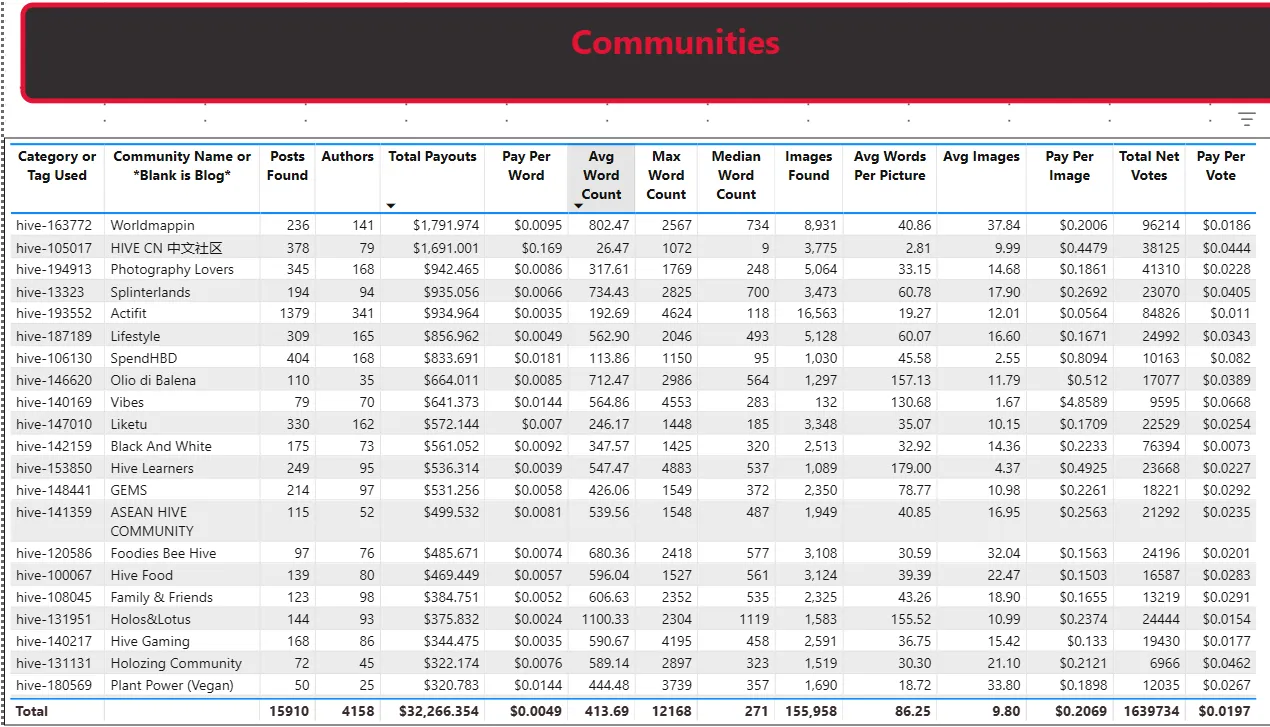
Finally, I have put together a view of the key metrics I'm looking into for this data set into a slice by community, sorted by total payouts.
Last Week
This Week
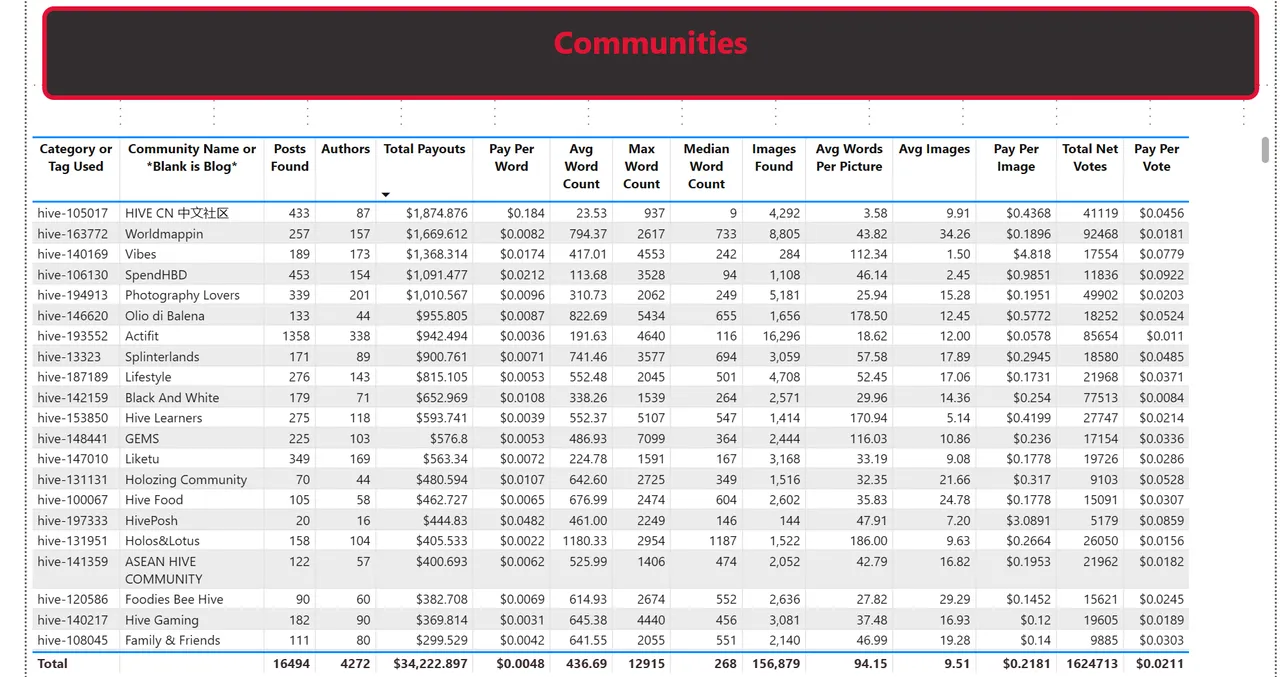
HIVE CN took the crown this week, and Spend HBD was down in volume by about $200. Wordmappin and Photography Lovers remained strong, and Splinterlands moved up a little.
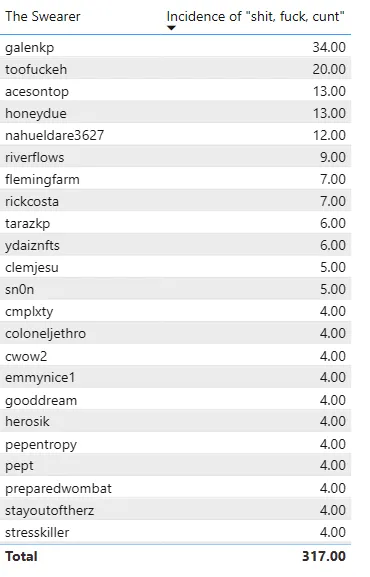
Who the fuck swears the most in their posts on HIVE? (Not comments, just posts!)
The only words, as an Aussie, that I consider swearing are "shit", "fuck", "cunt" (or variations thereof, so this captures "fucker", "fuckhead", "motherfucker", "shithead", etc
I think to no one's grand surprise, @galenkp continues to be the custodian of Hive's swear jar. Do try to be nicer to them, outside world. :)
Last Week:
This Week:
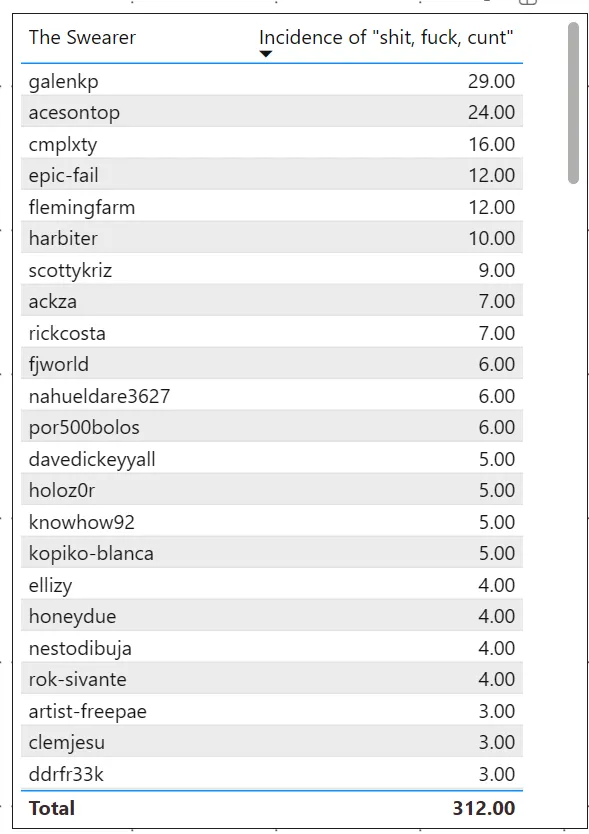
Less money in the swear jar this week, @galenkp, but you're still on top. Hive was 5 less words sweary this week, so well done everyone on watching the potty mouth in your posts! :P (Sarcasm) I will probably continue to appear in this list on account of this fucking post quoting the swear words that I am looking for.
Thanks for taking a look at the data. I'm still keen to get more ideas from you all on how this can be improved for future iterations and hope you enjoyed the new features, or whatever other metrics I might be able to extract.